
- Startseite >
- Seen >
- Chemie >
- Oberer Main - Elbe >
- Tiefste Stelle, Entnahmeturm >
- Jahresgrafik

Jahresgrafik Tiefste Stelle, Entnahmeturm / TWT Mauthaus-Hauptbecken
Daten vom 01.01.2018 bis zum 31.12.2018
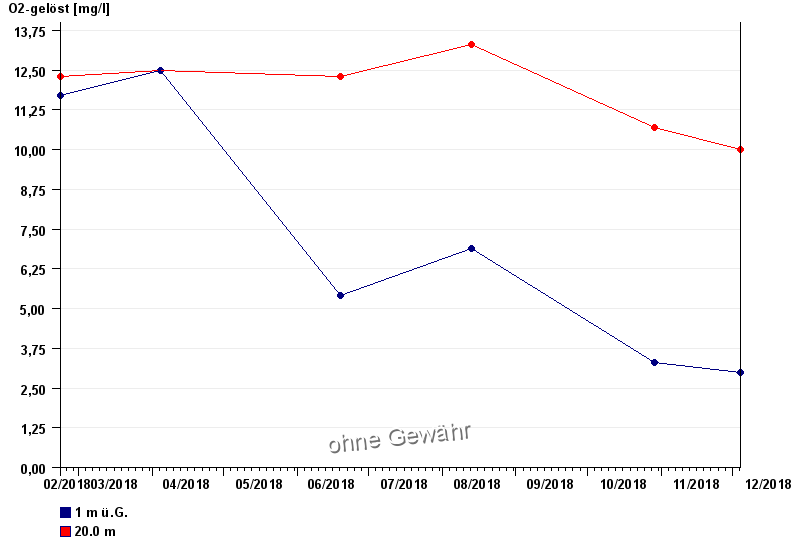
| Datum | O2-gelöst [mg/l] | ||
|---|---|---|---|
| 1 [m ü.G.] | 20,0 [m] | ||
| 04.12.2018 | 3 | 10 | |
| 29.10.2018 | 3,3 | 10,7 | |
| 13.08.2018 | 6,9 | 13,3 | |
| 19.06.2018 | 5,4 | 12,3 | |
| 04.04.2018 | 12,5 | 12,5 | |
| 21.02.2018 | 11,7 | 12,3 | |
© Bayerisches Landesamt für Umwelt 2024