
- Startseite >
- Meteorologie >
- Wind >
- Unterer Main >
- Hammelburg-Seeshof >
- Jahresgrafik

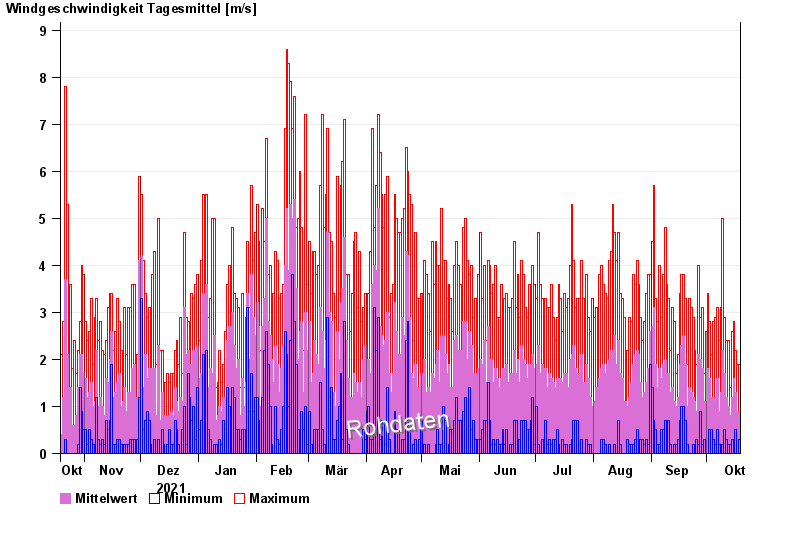
Jahresgrafik Hammelburg-Seeshof
Wind vom 19.10.2021 bis zum 18.10.2022
| Datum | Mittelwert [m/s] | Maximum [m/s] | Minimum [m/s] |
|---|---|---|---|
| 18.10.2022 | 0,9 | 1,9 | 0,3 |
| 17.10.2022 | 0,9 | 1,9 | 0,0 |
| 16.10.2022 | 1,3 | 2,2 | 0,5 |
| 15.10.2022 | 1,6 | 2,8 | 0,2 |
| 14.10.2022 | 1,2 | 2,6 | 0,3 |
| 13.10.2022 | 0,8 | 1,4 | 0,2 |
| 12.10.2022 | 1,0 | 2,4 | 0,2 |
© Bayerisches Landesamt für Umwelt 2024