
- Startseite >
- Meteorologie >
- Lufttemperatur >
- Regnitz >
- Gaibach-Kapellenberg >
- Jahresgrafik

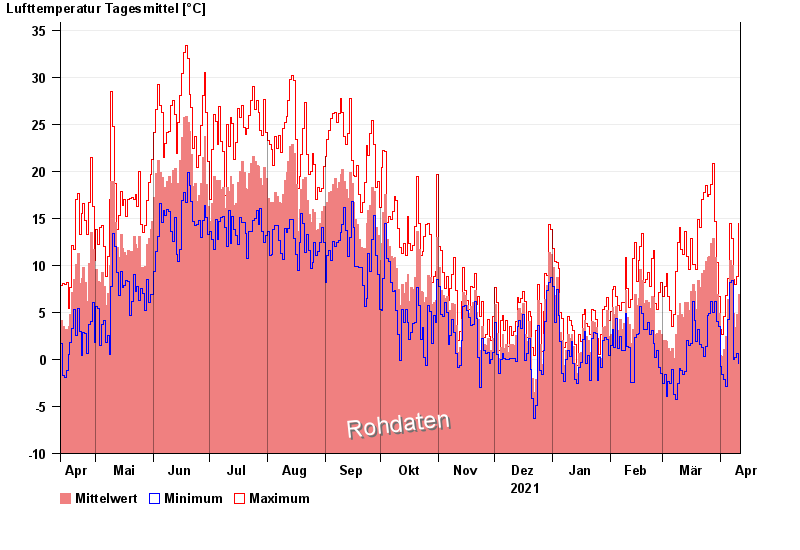
Jahresgrafik Gaibach-Kapellenberg
Lufttemperatur vom 12.04.2021 bis zum 11.04.2022
| Datum | Mittelwert [°C] | Maximum [°C] | Minimum [°C] |
|---|---|---|---|
| 11.04.2022 | 6,9 | 14,4 | -0,4 |
| 10.04.2022 | 4,8 | 8,8 | 0,6 |
| 09.04.2022 | 3,4 | 8,0 | 0,2 |
| 08.04.2022 | 4,9 | 8,5 | 0,0 |
| 07.04.2022 | 10,0 | 12,9 | 8,4 |
| 06.04.2022 | 10,5 | 14,4 | 8,2 |
| 05.04.2022 | 6,4 | 8,6 | 4,2 |
© Bayerisches Landesamt für Umwelt 2024