
- Startseite >
- Meteorologie >
- Lufttemperatur >
- Naab - Regen >
- Allmannsdorf >
- Jahresgrafik

Jahresgrafik Allmannsdorf
Lufttemperatur vom 24.05.2021 bis zum 23.05.2022
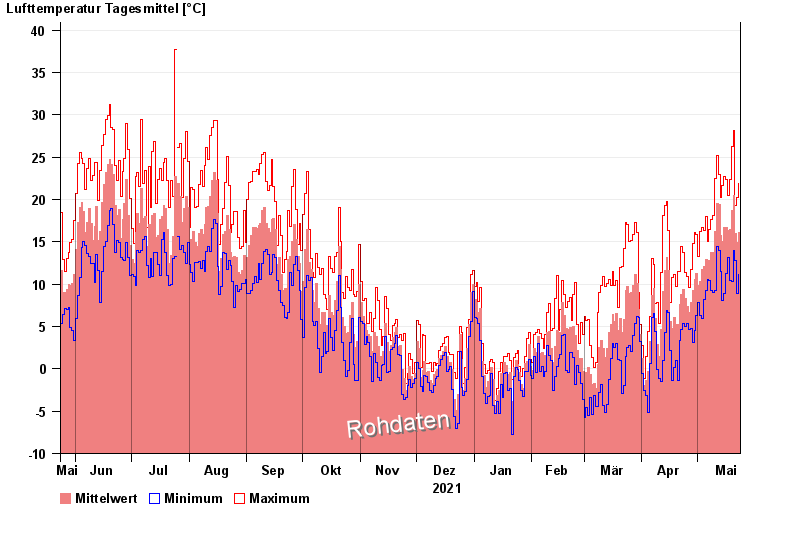
Hinweis: Die Zeitreihe im gewählten Zeitraum weist Lücken auf.
| Datum | Mittelwert [°C] | Maximum [°C] | Minimum [°C] |
|---|---|---|---|
| 23.05.2022 | 16,1 | 21,9 | 11,1 |
| 22.05.2022 | 14,9 | 20,2 | 8,9 |
| 21.05.2022 | 16,0 | 19,3 | 12,8 |
| 20.05.2022 | 20,5 | 28,1 | 14,0 |
| 19.05.2022 | 18,7 | 26,3 | 10,3 |
| 18.05.2022 | 16,4 | 22,4 | 10,4 |
| 17.05.2022 | 16,3 | 20,5 | 13,1 |
© Bayerisches Landesamt für Umwelt 2024