
- Startseite >
- Meteorologie >
- Lufttemperatur >
- Naab - Regen >
- Allmannsdorf >
- Jahresgrafik

Jahresgrafik Allmannsdorf
Lufttemperatur vom 08.03.2021 bis zum 07.03.2022
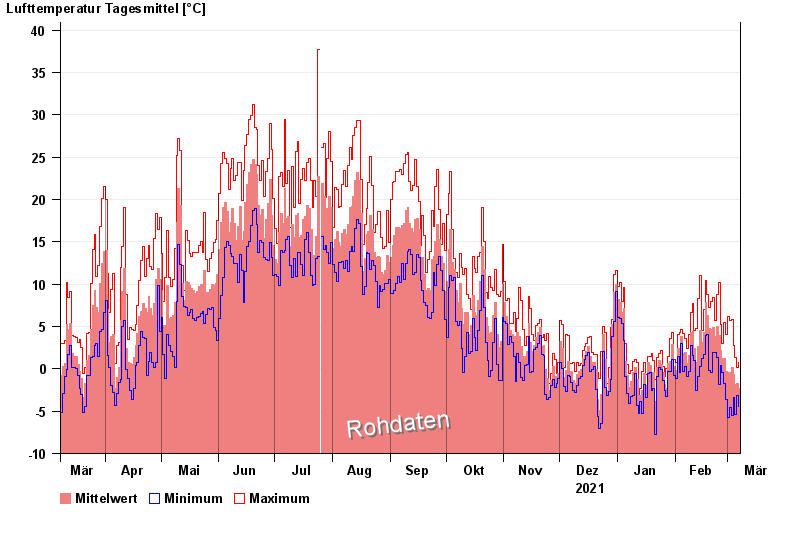
Hinweis: Die Zeitreihe im gewählten Zeitraum weist Lücken auf.
| Datum | Mittelwert [°C] | Maximum [°C] | Minimum [°C] |
|---|---|---|---|
| 07.03.2022 | -2,3 | 0,8 | -4,5 |
| 06.03.2022 | -1,7 | 0,2 | -3,2 |
| 05.03.2022 | -1,8 | 1,3 | -5,4 |
| 04.03.2022 | -0,7 | 2,8 | -3,4 |
| 03.03.2022 | 0,1 | 5,8 | -5,5 |
| 02.03.2022 | -0,4 | 5,7 | -4,6 |
| 01.03.2022 | -0,4 | 6,2 | -5,7 |
© Bayerisches Landesamt für Umwelt 2024