
- Startseite >
- Meteorologie >
- Lufttemperatur >
- Unterer Main >
- Veitshöchheim >
- Jahresgrafik

Jahresgrafik Veitshöchheim
Lufttemperatur vom 08.08.2020 bis zum 07.08.2021
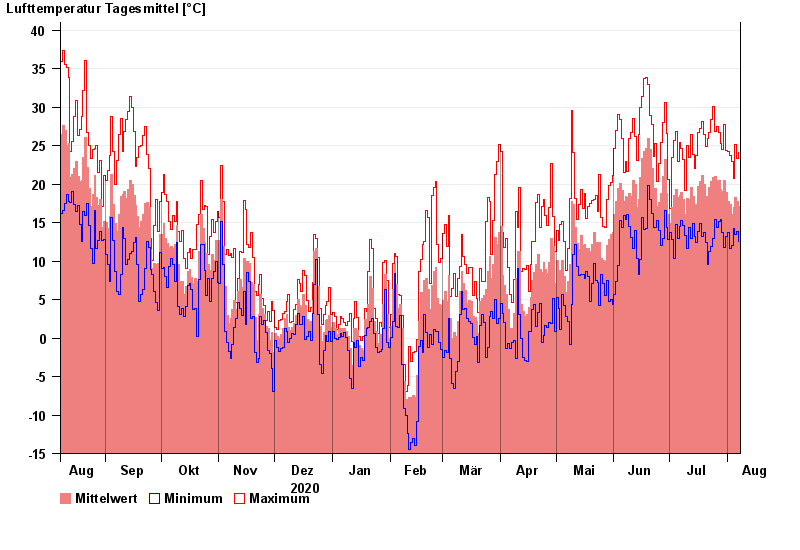
| Datum | Mittelwert [°C] | Maximum [°C] | Minimum [°C] |
|---|---|---|---|
| 07.08.2021 | 17,1 | 24,1 | 12,5 |
| 06.08.2021 | 17,8 | 23,3 | 13,8 |
| 05.08.2021 | 18,3 | 25,1 | 13,4 |
| 04.08.2021 | 16,9 | 20,7 | 14,2 |
| 03.08.2021 | 16,1 | 22,9 | 12,0 |
| 02.08.2021 | 17,3 | 23,7 | 11,7 |
| 01.08.2021 | 17,8 | 24,2 | 13,7 |
© Bayerisches Landesamt für Umwelt 2024