
- Startseite >
- Meteorologie >
- Lufttemperatur >
- Unterer Main >
- Seligenstadt >
- Jahresgrafik

Jahresgrafik Seligenstadt
Lufttemperatur vom 08.10.2022 bis zum 07.10.2023
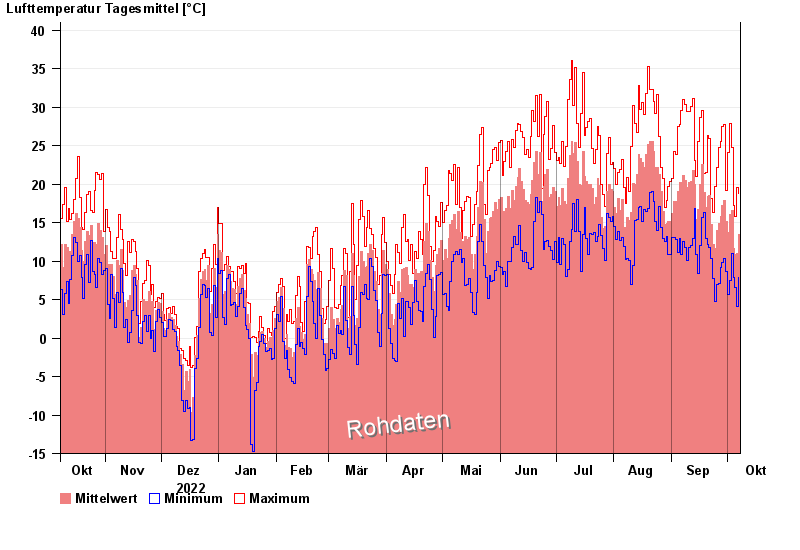
| Datum | Mittelwert [°C] | Maximum [°C] | Minimum [°C] |
|---|---|---|---|
| 07.10.2023 | 13,5 | 18,8 | 7,9 |
| 06.10.2023 | 11,0 | 19,5 | 4,1 |
| 05.10.2023 | 10,8 | 15,8 | 6,6 |
| 04.10.2023 | 11,7 | 17,2 | 7,9 |
| 03.10.2023 | 16,6 | 24,7 | 11,0 |
| 02.10.2023 | 16,1 | 27,9 | 7,5 |
| 01.10.2023 | 13,7 | 24,1 | 5,6 |
© Bayerisches Landesamt für Umwelt 2024