
- Startseite >
- Meteorologie >
- Lufttemperatur >
- Unterer Main >
- Albertshofen >
- Jahresgrafik

Jahresgrafik Albertshofen
Lufttemperatur vom 27.01.2020 bis zum 26.01.2021
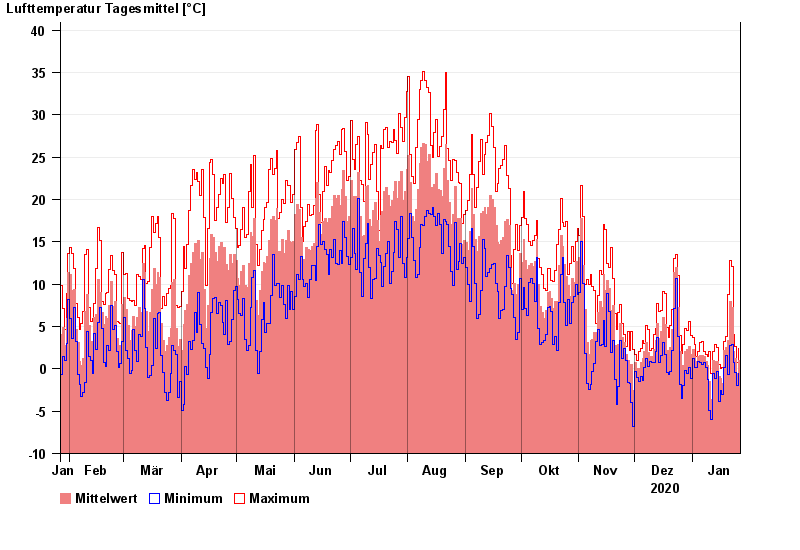
| Datum | Mittelwert [°C] | Maximum [°C] | Minimum [°C] |
|---|---|---|---|
| 26.01.2021 | 1,0 | 2,4 | -0,6 |
| 25.01.2021 | -0,5 | 0,8 | -2,0 |
| 24.01.2021 | 1,2 | 2,6 | -0,4 |
| 23.01.2021 | 2,1 | 4,1 | 0,8 |
| 22.01.2021 | 7,2 | 12,1 | 2,9 |
| 21.01.2021 | 8,0 | 12,8 | 2,8 |
| 20.01.2021 | 3,3 | 8,8 | -0,7 |
© Bayerisches Landesamt für Umwelt 2024