
- Startseite >
- Meteorologie >
- Lufttemperatur >
- Obere Donau >
- Greimersdorf >
- Jahresgrafik

Jahresgrafik Greimersdorf
Lufttemperatur vom 01.01.2017 bis zum 31.12.2017
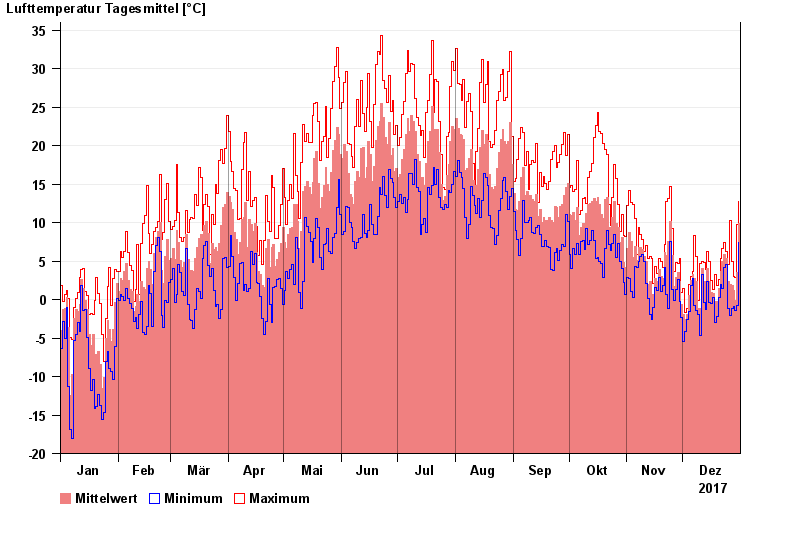
| Datum | Mittelwert [°C] | Maximum [°C] | Minimum [°C] |
|---|---|---|---|
| 31.12.2017 | 9,9 | 12,7 | 7,4 |
| 30.12.2017 | 3,5 | 9,7 | -0,8 |
| 29.12.2017 | -0,1 | 2,9 | -1,4 |
| 28.12.2017 | 1,2 | 3,0 | -0,9 |
| 27.12.2017 | 1,8 | 4,9 | -1,1 |
| 26.12.2017 | 1,9 | 10,3 | -2,1 |
| 25.12.2017 | 2,4 | 4,6 | -1,2 |
© Bayerisches Landesamt für Umwelt 2024