
- Startseite >
- Meteorologie >
- Lufttemperatur >
- Isar >
- Spitzingsee Freiland 1 >
- Jahresgrafik

Jahresgrafik Spitzingsee Freiland 1
Lufttemperatur vom 01.01.2024 bis zum 31.12.2024
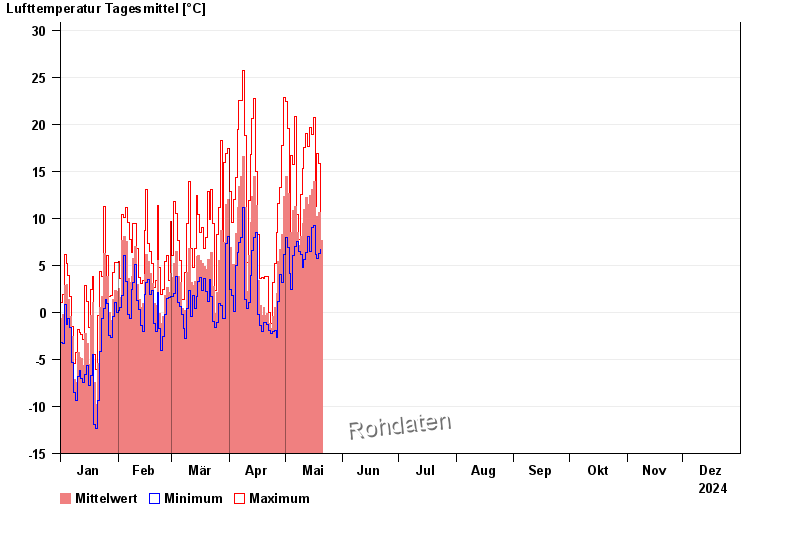
| Datum | Mittelwert [°C] | Maximum [°C] | Minimum [°C] |
|---|---|---|---|
| 14.05.2024 | 11,9 | 19,7 | 6,5 |
| 13.05.2024 | 11,5 | 17,6 | 8,1 |
| 12.05.2024 | 12,2 | 19,0 | 6,4 |
| 11.05.2024 | 10,9 | 17,5 | 5,6 |
| 10.05.2024 | 9,4 | 15,3 | 4,8 |
| 09.05.2024 | 8,1 | 12,5 | 6,2 |
| 08.05.2024 | 7,1 | 7,8 | 6,5 |
© Bayerisches Landesamt für Umwelt 2024