
- Startseite >
- Meteorologie >
- Lufttemperatur >
- Iller - Lech - Bodensee >
- Schwabmünchen >
- Jahresgrafik

Jahresgrafik Schwabmünchen
Lufttemperatur vom 27.04.2024 bis zum 26.04.2025
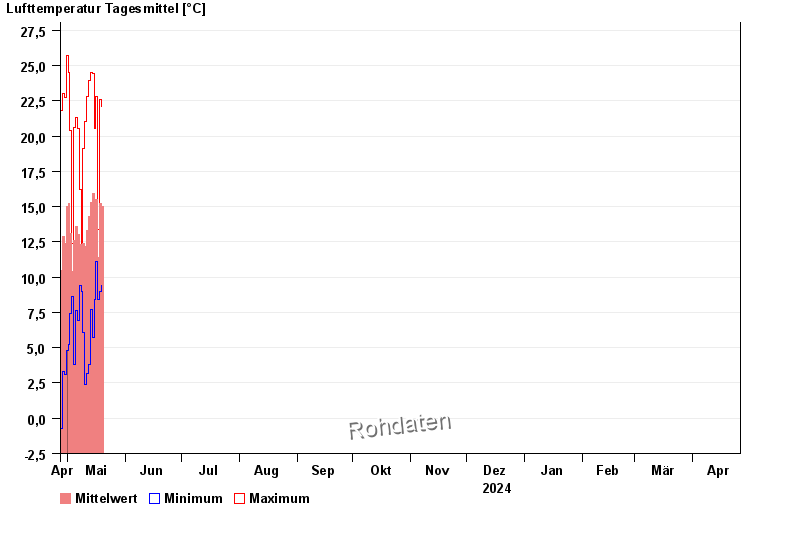
| Datum | Mittelwert [°C] | Maximum [°C] | Minimum [°C] |
|---|---|---|---|
| 07.05.2024 | 11,9 | 16,2 | 9,4 |
| 06.05.2024 | 13,0 | 20,5 | 6,9 |
| 05.05.2024 | 13,6 | 21,3 | 7,6 |
| 04.05.2024 | 12,6 | 20,6 | 3,8 |
| 03.05.2024 | 10,4 | 12,4 | 8,6 |
| 02.05.2024 | 13,1 | 20,4 | 7,4 |
| 01.05.2024 | 15,2 | 24,5 | 5,2 |
© Bayerisches Landesamt für Umwelt 2024