
- Startseite >
- Meteorologie >
- Lufttemperatur >
- Oberer Main - Elbe >
- Mauthaus (Klimastation) >
- Jahresgrafik

Jahresgrafik Mauthaus (Klimastation)
Lufttemperatur vom 16.10.2020 bis zum 15.10.2021
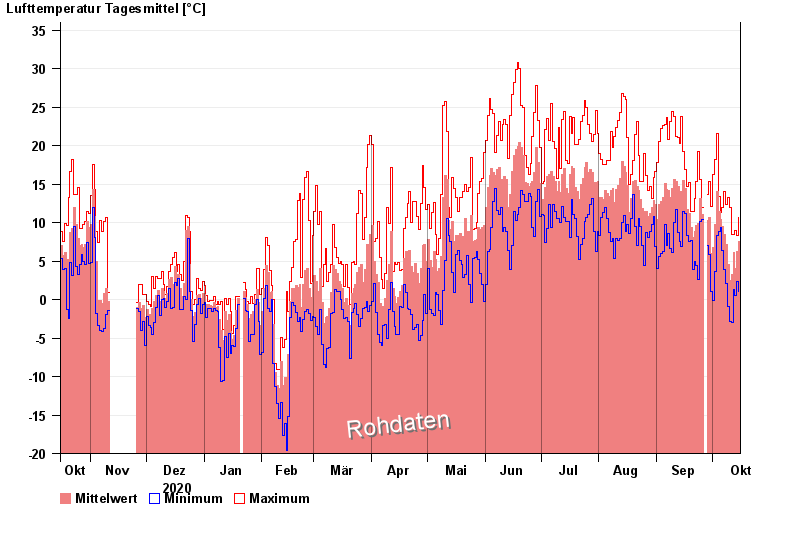
Hinweis: Die Zeitreihe im gewählten Zeitraum weist Lücken auf.
| Datum | Mittelwert [°C] | Maximum [°C] | Minimum [°C] |
|---|---|---|---|
| 15.10.2021 | 7,6 | 10,6 | 1,0 |
| 14.10.2021 | 6,3 | 8,3 | 2,4 |
| 13.10.2021 | 4,0 | 9,0 | 0,5 |
| 12.10.2021 | 6,1 | 8,4 | 1,3 |
| 11.10.2021 | 3,2 | 8,5 | -3,0 |
| 10.10.2021 | 2,5 | 11,9 | -2,8 |
| 09.10.2021 | 4,5 | 13,3 | -0,9 |
© Bayerisches Landesamt für Umwelt 2024