
- Startseite >
- Meteorologie >
- Lufttemperatur >
- Oberer Main - Elbe >
- Mauthaus (Klimastation) >
- Jahresgrafik

Jahresgrafik Mauthaus (Klimastation)
Lufttemperatur vom 01.01.2019 bis zum 31.12.2019
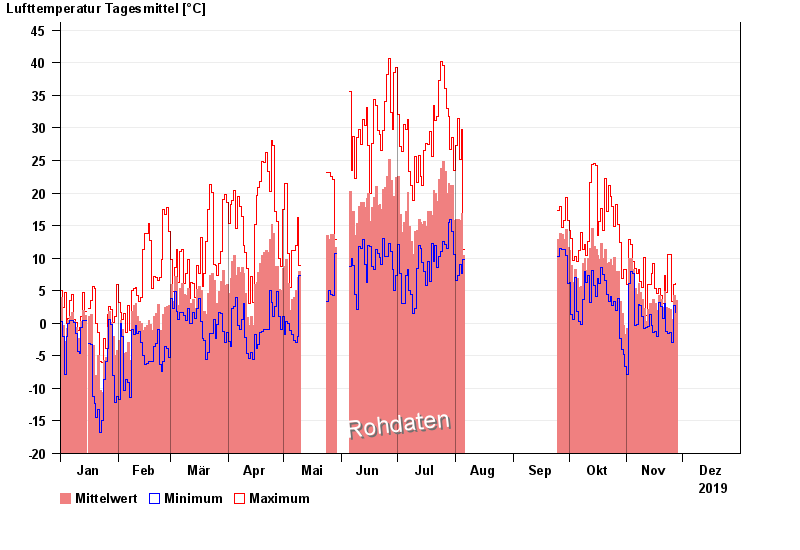
Hinweis: Die Zeitreihe im gewählten Zeitraum weist Lücken auf.
| Datum | Mittelwert [°C] | Maximum [°C] | Minimum [°C] |
|---|---|---|---|
| 27.11.2019 | 3,5 | 6,1 | 1,6 |
| 26.11.2019 | 4,2 | 5,9 | 2,7 |
| 25.11.2019 | 0,6 | 3,3 | -3,0 |
| 24.11.2019 | 2,1 | 10,6 | -1,4 |
| 23.11.2019 | 2,2 | 10,6 | -1,5 |
| 22.11.2019 | 2,4 | 4,7 | -1,2 |
| 21.11.2019 | 4,9 | 7,4 | 3,0 |
© Bayerisches Landesamt für Umwelt 2024