
- Startseite >
- Meteorologie >
- Lufttemperatur >
- Bayern >
- Gut Hüll >
- Jahresgrafik

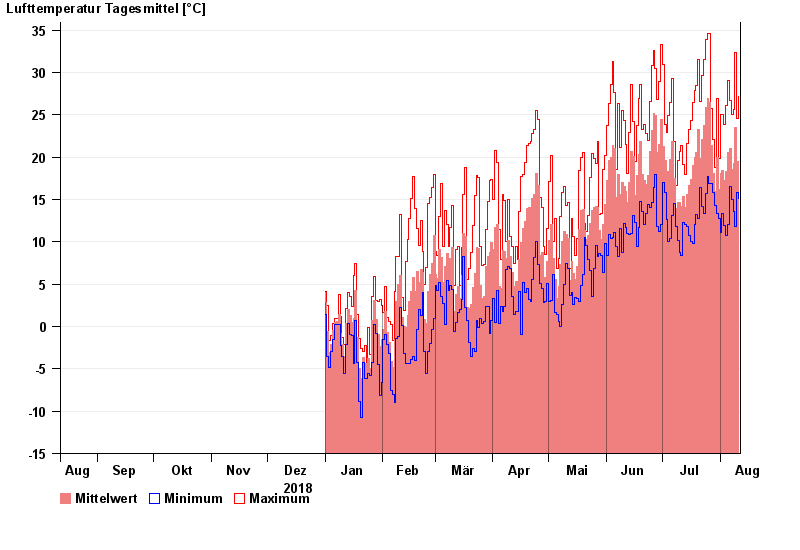
Jahresgrafik Gut Hüll
Lufttemperatur vom 12.08.2018 bis zum 11.08.2019
Hinweis
Station aufgelassen am 06.07.2016 !
| Datum | Mittelwert [°C] | Maximum [°C] | Minimum [°C] |
|---|---|---|---|
| 11.08.2019 | 21,4 | 27,2 | 15,1 |
| 10.08.2019 | 19,5 | 24,6 | 15,8 |
| 09.08.2019 | 23,5 | 32,4 | 11,8 |
| 08.08.2019 | 19,2 | 25,6 | 13,6 |
| 07.08.2019 | 18,6 | 25,0 | 15,0 |
| 06.08.2019 | 21,0 | 26,7 | 16,5 |
| 05.08.2019 | 20,6 | 29,1 | 12,0 |
© Bayerisches Landesamt für Umwelt 2024