
- Startseite >
- Meteorologie >
- Lufttemperatur >
- Bayern >
- Bischbrunn >
- Jahresgrafik

Jahresgrafik Bischbrunn
Lufttemperatur vom 06.06.2023 bis zum 05.06.2024
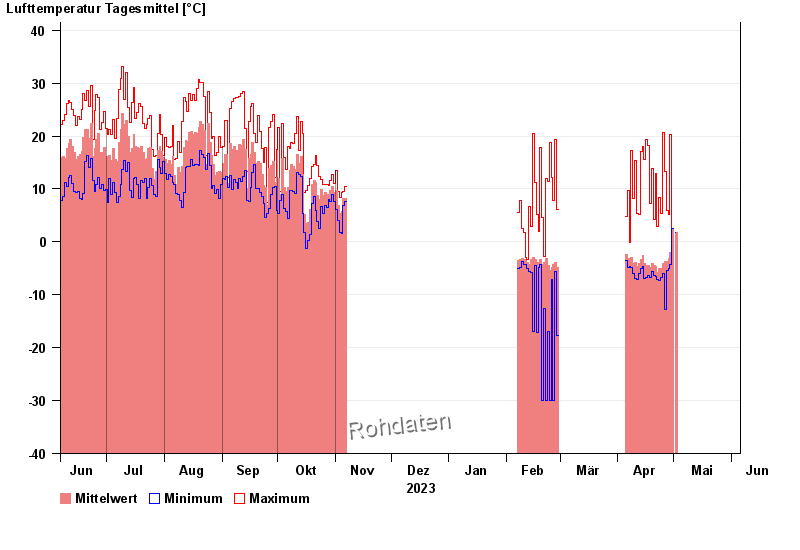
Hinweis: Die Zeitreihe im gewählten Zeitraum weist Lücken auf.
| Datum | Mittelwert [°C] | Maximum [°C] | Minimum [°C] |
|---|---|---|---|
| 26.04.2024 | -3,8 | 13,3 | -12,7 |
| 25.04.2024 | -4,1 | 20,7 | -6,0 |
| 24.04.2024 | -5,0 | 5,4 | -6,7 |
| 23.04.2024 | -5,0 | 8,3 | -7,3 |
| 22.04.2024 | -5,7 | 2,9 | -7,1 |
| 21.04.2024 | -4,6 | 13,0 | -6,6 |
| 20.04.2024 | -4,5 | 4,3 | -6,3 |
© Bayerisches Landesamt für Umwelt 2024