
- Startseite >
- Meteorologie >
- Relative Luftfeuchte >
- Regnitz >
- Obersteinbach >
- Jahresgrafik

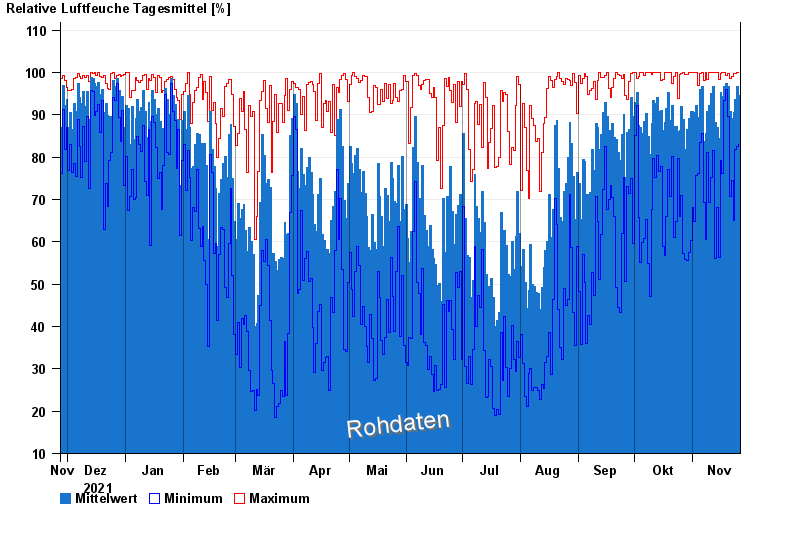
Jahresgrafik Obersteinbach
Relative Luftfeuchte vom 27.11.2021 bis zum 26.11.2022
| Datum | Mittelwert [%] | Maximum [%] | Minimum [%] |
|---|---|---|---|
| 26.11.2022 | 94,6 | 100,0 | 83,1 |
| 25.11.2022 | 96,6 | 100,0 | 82,5 |
| 24.11.2022 | 93,7 | 99,7 | 81,9 |
| 23.11.2022 | 90,6 | 99,8 | 65,0 |
| 22.11.2022 | 89,1 | 99,1 | 74,6 |
| 21.11.2022 | 90,7 | 98,7 | 70,8 |
| 20.11.2022 | 96,8 | 99,7 | 89,7 |
© Bayerisches Landesamt für Umwelt 2024