
- Startseite >
- Meteorologie >
- Relative Luftfeuchte >
- Regnitz >
- Gaibach-Kapellenberg >
- Jahresgrafik

Jahresgrafik Gaibach-Kapellenberg
Relative Luftfeuchte vom 26.10.2022 bis zum 25.10.2023
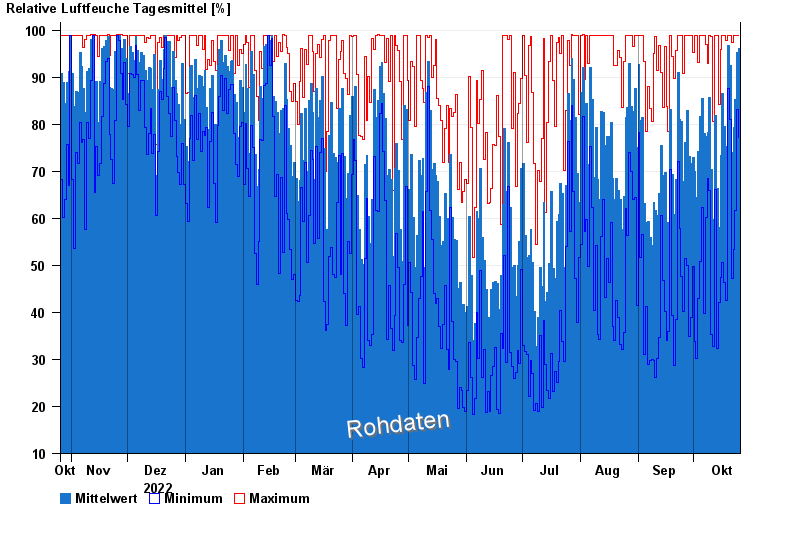
| Datum | Mittelwert [%] | Maximum [%] | Minimum [%] |
|---|---|---|---|
| 25.10.2023 | 96,2 | 98,8 | 77,2 |
| 24.10.2023 | 95,2 | 98,8 | 83,1 |
| 23.10.2023 | 85,2 | 98,8 | 61,6 |
| 22.10.2023 | 79,3 | 98,8 | 53,3 |
| 21.10.2023 | 74,0 | 97,3 | 47,2 |
| 20.10.2023 | 92,6 | 98,8 | 81,0 |
| 19.10.2023 | 96,7 | 98,9 | 87,7 |
© Bayerisches Landesamt für Umwelt 2024