
- Startseite >
- Meteorologie >
- Relative Luftfeuchte >
- Regnitz >
- Gaibach-Kapellenberg >
- Jahresgrafik

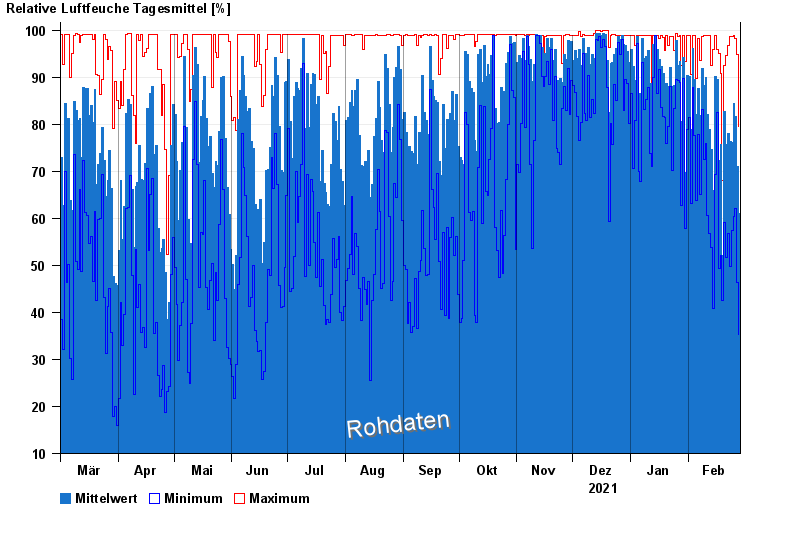
Jahresgrafik Gaibach-Kapellenberg
Relative Luftfeuchte vom 01.03.2021 bis zum 28.02.2022
| Datum | Mittelwert [%] | Maximum [%] | Minimum [%] |
|---|---|---|---|
| 28.02.2022 | 61,1 | 79,5 | 35,4 |
| 27.02.2022 | 71,1 | 94,8 | 46,3 |
| 26.02.2022 | 81,6 | 98,2 | 62,1 |
| 25.02.2022 | 84,5 | 98,9 | 60,3 |
| 24.02.2022 | 76,1 | 98,6 | 57,5 |
| 23.02.2022 | 76,4 | 98,7 | 49,7 |
| 22.02.2022 | 78,0 | 96,7 | 56,8 |
© Bayerisches Landesamt für Umwelt 2024