
- Startseite >
- Meteorologie >
- Relative Luftfeuchte >
- Untere Donau >
- Schönbrunn >
- Jahresgrafik

Jahresgrafik Schönbrunn
Relative Luftfeuchte vom 03.03.2021 bis zum 02.03.2022
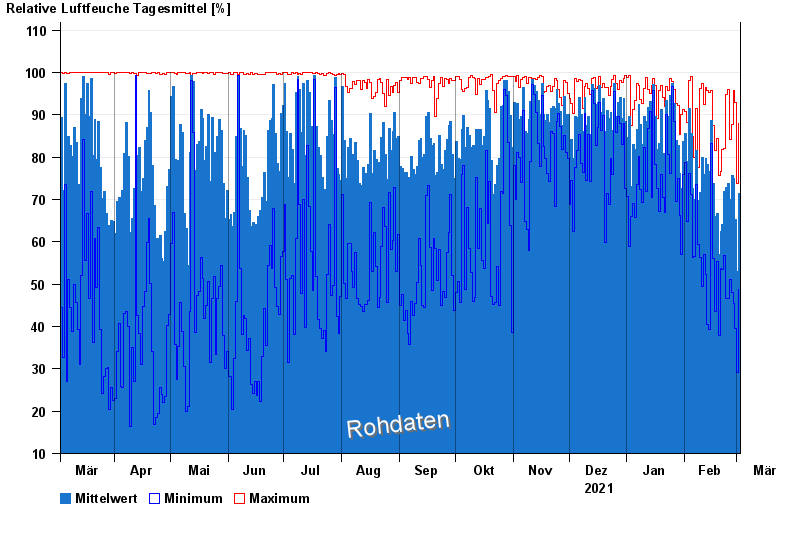
| Datum | Mittelwert [%] | Maximum [%] | Minimum [%] |
|---|---|---|---|
| 02.03.2022 | 71,4 | 88,0 | 48,8 |
| 01.03.2022 | 53,0 | 73,9 | 29,1 |
| 28.02.2022 | 65,3 | 92,9 | 39,6 |
| 27.02.2022 | 75,0 | 95,8 | 45,5 |
| 26.02.2022 | 75,7 | 87,7 | 48,1 |
| 25.02.2022 | 69,9 | 84,2 | 51,2 |
| 24.02.2022 | 73,8 | 96,1 | 46,6 |
© Bayerisches Landesamt für Umwelt 2024