
- Startseite >
- Meteorologie >
- Relative Luftfeuchte >
- Untere Donau >
- Ruhstorf a. d. Rott >
- Jahresgrafik

Jahresgrafik Ruhstorf a. d. Rott
Relative Luftfeuchte vom 01.12.2020 bis zum 30.11.2021
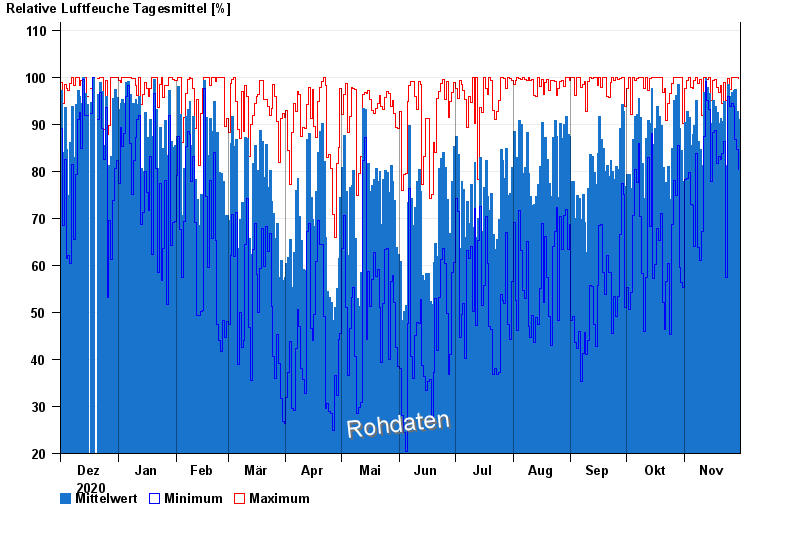
Hinweis: Die Zeitreihe im gewählten Zeitraum weist Lücken auf.
| Datum | Mittelwert [%] | Maximum [%] | Minimum [%] |
|---|---|---|---|
| 30.11.2021 | 91,1 | 99,8 | 80,3 |
| 29.11.2021 | 92,8 | 100,0 | 84,6 |
| 28.11.2021 | 97,4 | 100,0 | 86,7 |
| 27.11.2021 | 97,1 | 99,9 | 93,7 |
| 26.11.2021 | 96,8 | 100,0 | 94,4 |
| 25.11.2021 | 96,0 | 97,3 | 93,8 |
| 24.11.2021 | 98,4 | 99,8 | 95,8 |
© Bayerisches Landesamt für Umwelt 2024