
- Startseite >
- Meteorologie >
- Relative Luftfeuchte >
- Untere Donau >
- Allmannsdorf >
- Jahresgrafik

Jahresgrafik Allmannsdorf
Relative Luftfeuchte vom 01.01.2021 bis zum 31.12.2021
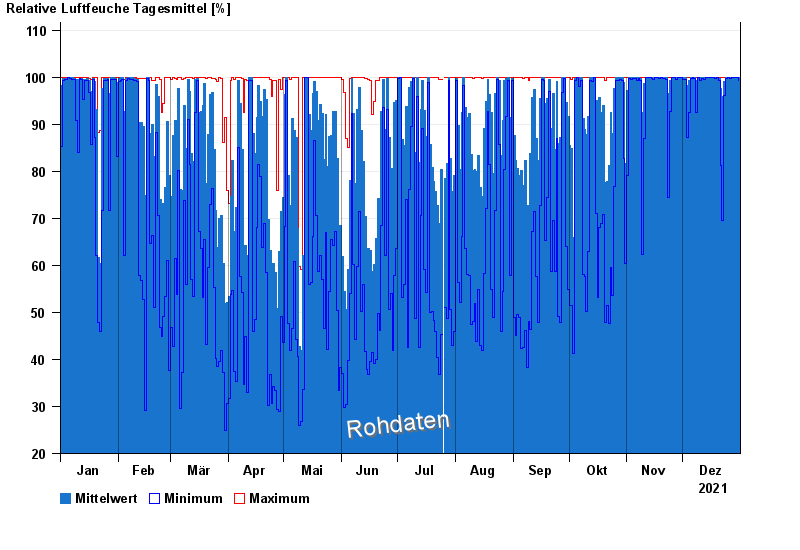
Hinweis: Die Zeitreihe im gewählten Zeitraum weist Lücken auf.
| Datum | Mittelwert [%] | Maximum [%] | Minimum [%] |
|---|---|---|---|
| 31.12.2021 | 99,9 | 100,0 | 99,4 |
| 30.12.2021 | 100,0 | 100,0 | 100,0 |
| 29.12.2021 | 100,0 | 100,0 | 99,9 |
| 28.12.2021 | 100,0 | 100,0 | 100,0 |
| 27.12.2021 | 100,0 | 100,0 | 100,0 |
| 26.12.2021 | 100,0 | 100,0 | 99,8 |
| 25.12.2021 | 100,0 | 100,0 | 100,0 |
© Bayerisches Landesamt für Umwelt 2025