
- Startseite >
- Meteorologie >
- Relative Luftfeuchte >
- Naab - Regen >
- Allmannsdorf >
- Jahresgrafik

Jahresgrafik Allmannsdorf
Relative Luftfeuchte vom 27.01.2024 bis zum 26.01.2025
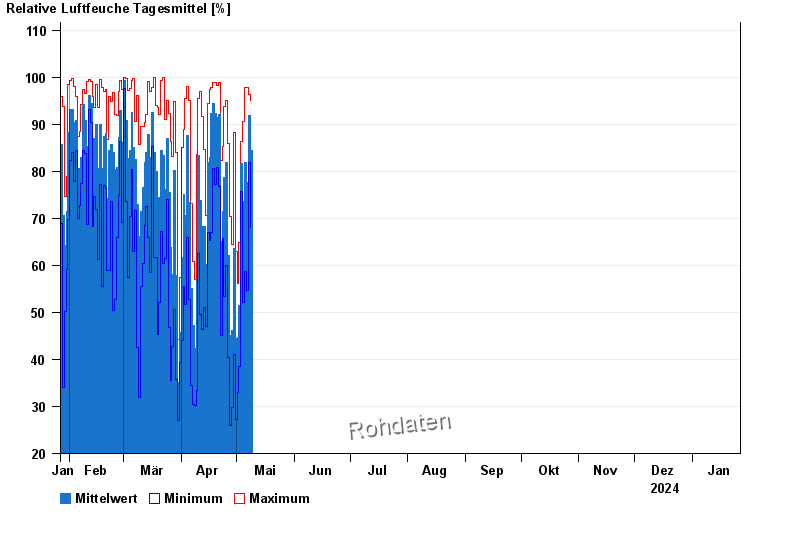
| Datum | Mittelwert [%] | Maximum [%] | Minimum [%] |
|---|---|---|---|
| 27.04.2024 | 67,1 | 70,3 | 64,8 |
| 26.04.2024 | 62,1 | 86,0 | 40,5 |
| 25.04.2024 | 81,8 | 95,0 | 60,0 |
| 24.04.2024 | 78,6 | 93,8 | 53,3 |
| 23.04.2024 | 71,4 | 85,2 | 65,7 |
| 22.04.2024 | 65,0 | 82,3 | 45,1 |
| 21.04.2024 | 92,0 | 98,8 | 76,7 |
© Bayerisches Landesamt für Umwelt 2024