
- Startseite >
- Meteorologie >
- Relative Luftfeuchte >
- Naab - Regen >
- Allmannsdorf >
- Jahresgrafik

Jahresgrafik Allmannsdorf
Relative Luftfeuchte vom 27.01.2019 bis zum 26.01.2020
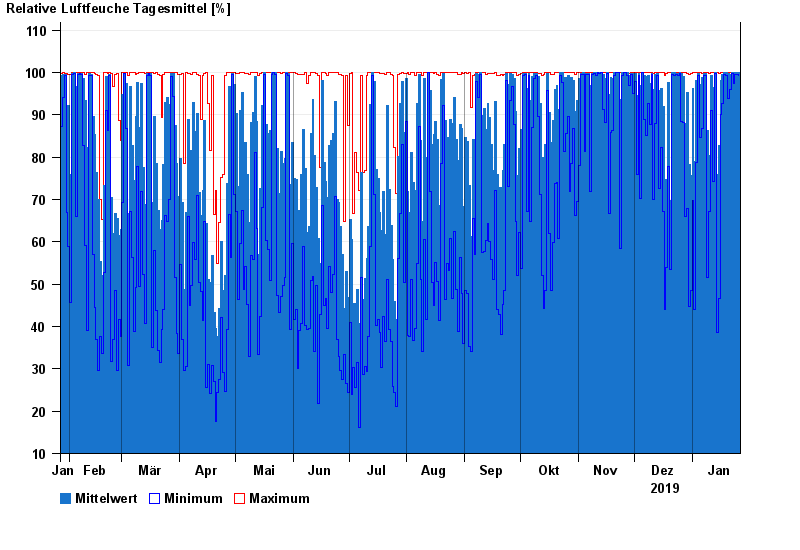
| Datum | Mittelwert [%] | Maximum [%] | Minimum [%] |
|---|---|---|---|
| 26.01.2020 | 99,9 | 100,0 | 99,4 |
| 25.01.2020 | 99,9 | 100,0 | 99,6 |
| 24.01.2020 | 99,9 | 100,0 | 99,6 |
| 23.01.2020 | 99,8 | 100,0 | 97,4 |
| 22.01.2020 | 100,0 | 100,0 | 99,8 |
| 21.01.2020 | 99,6 | 100,0 | 95,9 |
| 20.01.2020 | 99,8 | 100,0 | 93,9 |
© Bayerisches Landesamt für Umwelt 2024