
- Startseite >
- Meteorologie >
- Relative Luftfeuchte >
- Unterer Main >
- Veitshöchheim >
- Jahresgrafik

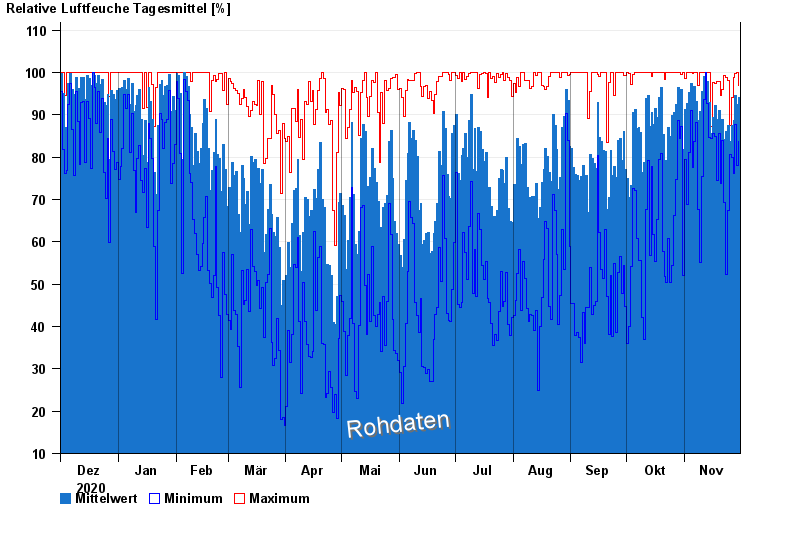
Jahresgrafik Veitshöchheim
Relative Luftfeuchte vom 01.12.2020 bis zum 30.11.2021
| Datum | Mittelwert [%] | Maximum [%] | Minimum [%] |
|---|---|---|---|
| 30.11.2021 | 94,2 | 96,9 | 83,7 |
| 29.11.2021 | 92,4 | 99,9 | 78,1 |
| 28.11.2021 | 94,5 | 99,7 | 87,7 |
| 27.11.2021 | 88,7 | 98,9 | 76,2 |
| 26.11.2021 | 87,5 | 94,2 | 79,9 |
| 25.11.2021 | 83,6 | 87,4 | 80,7 |
| 24.11.2021 | 87,5 | 98,2 | 67,5 |
© Bayerisches Landesamt für Umwelt 2024