
- Startseite >
- Meteorologie >
- Relative Luftfeuchte >
- Unterer Main >
- Seligenstadt >
- Jahresgrafik

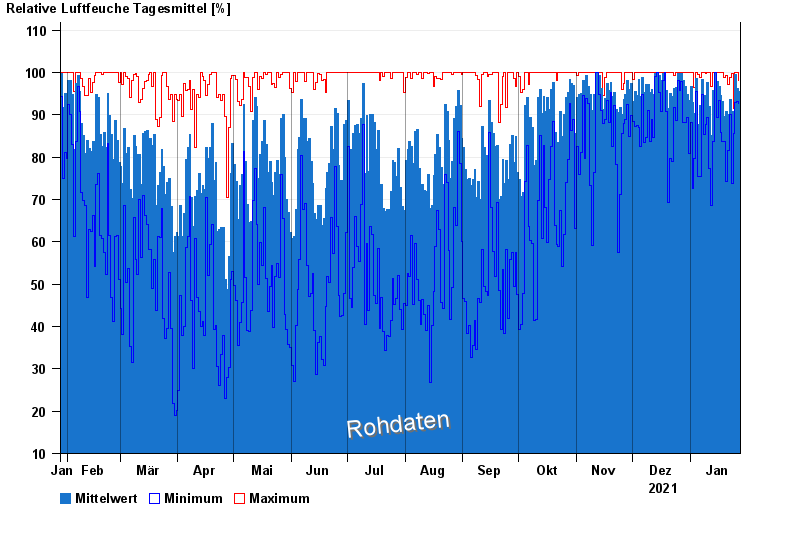
Jahresgrafik Seligenstadt
Relative Luftfeuchte vom 28.01.2021 bis zum 27.01.2022
| Datum | Mittelwert [%] | Maximum [%] | Minimum [%] |
|---|---|---|---|
| 27.01.2022 | 95,5 | 98,1 | 92,8 |
| 26.01.2022 | 96,3 | 99,9 | 93,2 |
| 25.01.2022 | 99,5 | 99,9 | 93,0 |
| 24.01.2022 | 88,6 | 91,6 | 85,5 |
| 23.01.2022 | 90,8 | 99,8 | 73,9 |
| 22.01.2022 | 93,7 | 98,9 | 90,2 |
| 21.01.2022 | 90,0 | 97,1 | 81,6 |
© Bayerisches Landesamt für Umwelt 2024