
- Startseite >
- Meteorologie >
- Relative Luftfeuchte >
- Unterer Main >
- Seligenstadt >
- Jahresgrafik

Jahresgrafik Seligenstadt
Relative Luftfeuchte vom 24.05.2023 bis zum 23.05.2024
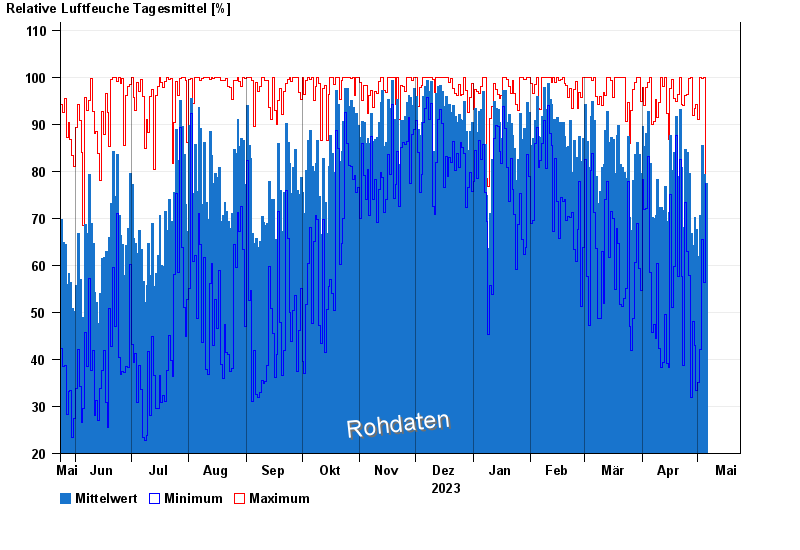
| Datum | Mittelwert [%] | Maximum [%] | Minimum [%] |
|---|---|---|---|
| 25.04.2024 | 88,8 | 96,4 | 62,9 |
| 24.04.2024 | 84,7 | 96,2 | 73,3 |
| 23.04.2024 | 68,0 | 94,0 | 38,7 |
| 22.04.2024 | 80,8 | 94,3 | 57,7 |
| 21.04.2024 | 93,2 | 99,9 | 82,5 |
| 20.04.2024 | 79,0 | 96,4 | 57,7 |
| 19.04.2024 | 91,6 | 94,9 | 87,6 |
© Bayerisches Landesamt für Umwelt 2024