
- Startseite >
- Meteorologie >
- Relative Luftfeuchte >
- Unterer Main >
- Seligenstadt >
- Jahresgrafik

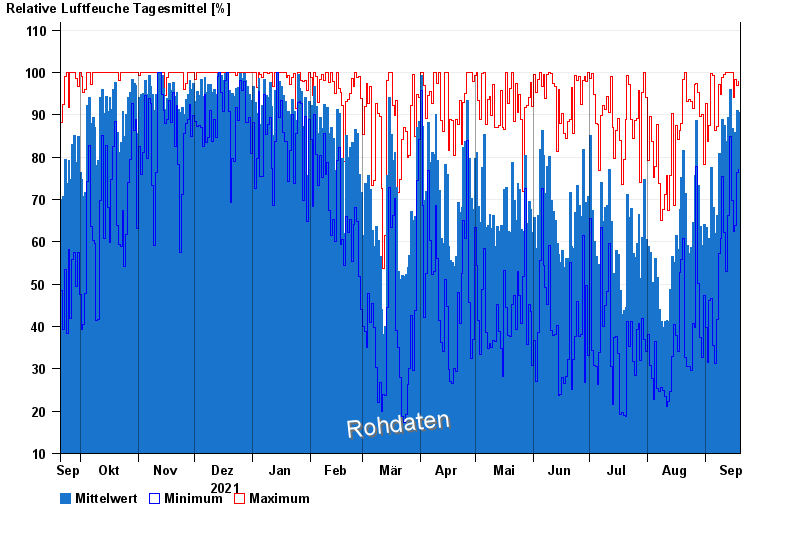
Jahresgrafik Seligenstadt
Relative Luftfeuchte vom 20.09.2021 bis zum 19.09.2022
| Datum | Mittelwert [%] | Maximum [%] | Minimum [%] |
|---|---|---|---|
| 19.09.2022 | 90,5 | 97,8 | 77,2 |
| 18.09.2022 | 91,1 | 97,0 | 76,3 |
| 17.09.2022 | 85,8 | 98,4 | 63,8 |
| 16.09.2022 | 79,0 | 94,1 | 62,5 |
| 15.09.2022 | 86,7 | 100,0 | 69,8 |
| 14.09.2022 | 96,0 | 100,0 | 84,9 |
| 13.09.2022 | 89,3 | 99,9 | 66,2 |
© Bayerisches Landesamt für Umwelt 2024