
- Startseite >
- Meteorologie >
- Relative Luftfeuchte >
- Unterer Main >
- Helmstadt >
- Jahresgrafik

Jahresgrafik Helmstadt
Relative Luftfeuchte vom 01.01.2022 bis zum 31.12.2022
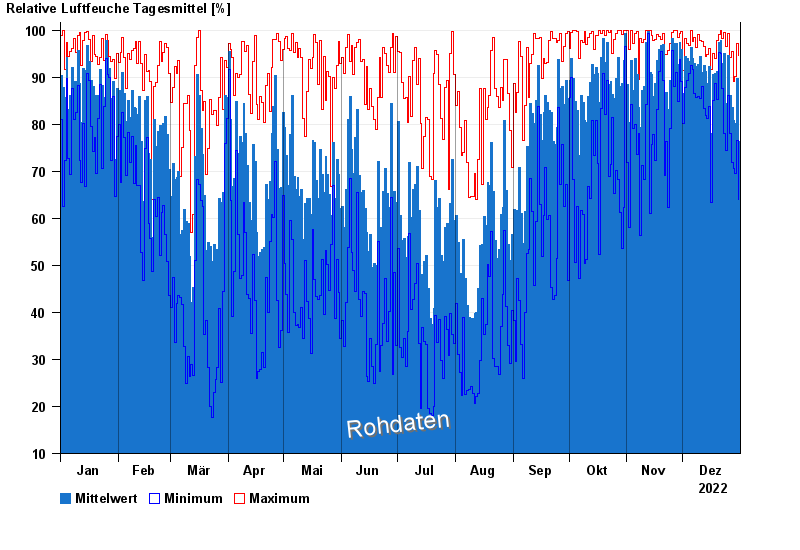
| Datum | Mittelwert [%] | Maximum [%] | Minimum [%] |
|---|---|---|---|
| 31.12.2022 | 76,4 | 94,7 | 63,9 |
| 30.12.2022 | 89,8 | 97,2 | 76,6 |
| 29.12.2022 | 80,1 | 90,1 | 69,5 |
| 28.12.2022 | 80,8 | 89,0 | 70,7 |
| 27.12.2022 | 83,6 | 95,5 | 71,8 |
| 26.12.2022 | 86,1 | 94,2 | 78,1 |
| 25.12.2022 | 94,6 | 99,4 | 86,2 |
© Bayerisches Landesamt für Umwelt 2024