
- Startseite >
- Meteorologie >
- Relative Luftfeuchte >
- Unterer Main >
- Heilsbronn_Aich >
- Jahresgrafik

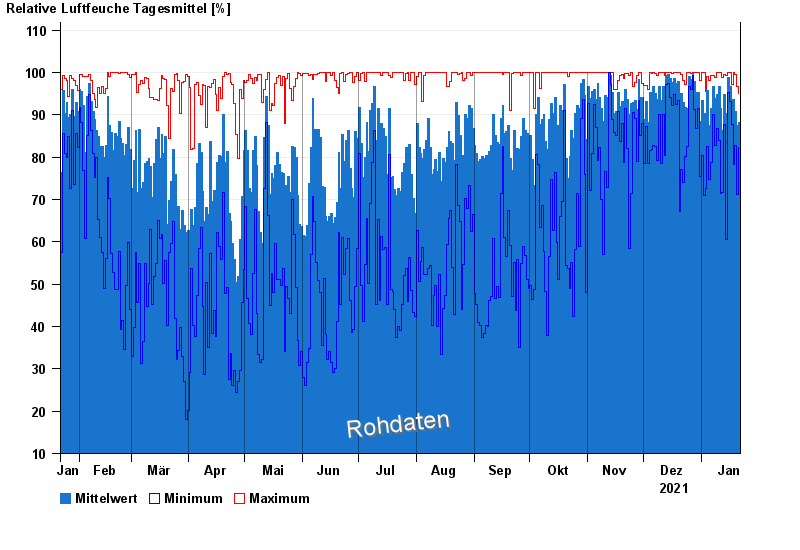
Jahresgrafik Heilsbronn_Aich
Relative Luftfeuchte vom 22.01.2021 bis zum 21.01.2022
| Datum | Mittelwert [%] | Maximum [%] | Minimum [%] |
|---|---|---|---|
| 21.01.2022 | 88,2 | 95,0 | 82,4 |
| 20.01.2022 | 87,4 | 96,7 | 71,3 |
| 19.01.2022 | 90,9 | 99,5 | 82,7 |
| 18.01.2022 | 93,7 | 100,0 | 78,3 |
| 17.01.2022 | 93,7 | 97,2 | 87,7 |
| 16.01.2022 | 96,6 | 100,0 | 93,2 |
| 15.01.2022 | 98,9 | 100,0 | 95,3 |
© Bayerisches Landesamt für Umwelt 2024