
- Startseite >
- Meteorologie >
- Relative Luftfeuchte >
- Unterer Main >
- Greimersdorf >
- Jahresgrafik

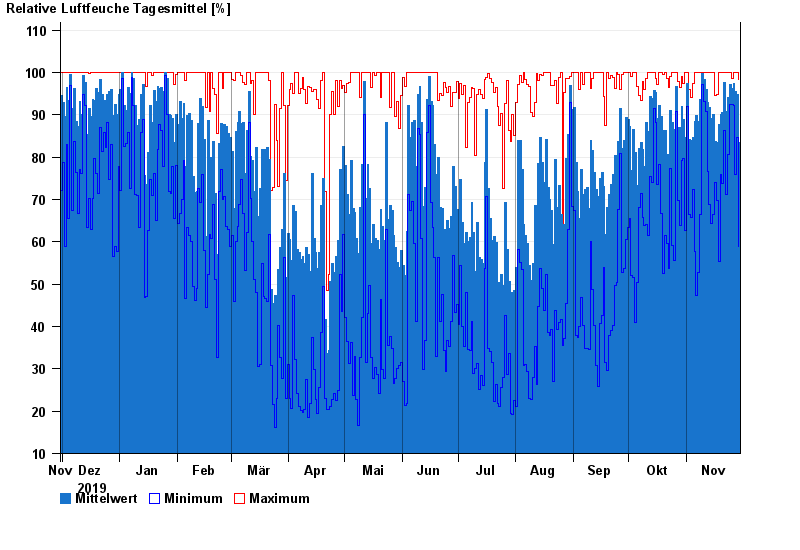
Jahresgrafik Greimersdorf
Relative Luftfeuchte vom 30.11.2019 bis zum 29.11.2020
| Datum | Mittelwert [%] | Maximum [%] | Minimum [%] |
|---|---|---|---|
| 29.11.2020 | 83,4 | 98,3 | 58,8 |
| 28.11.2020 | 94,8 | 100,0 | 84,7 |
| 27.11.2020 | 95,5 | 100,0 | 75,8 |
| 26.11.2020 | 97,4 | 100,0 | 92,3 |
| 25.11.2020 | 96,3 | 98,5 | 92,4 |
| 24.11.2020 | 97,2 | 100,0 | 92,5 |
| 23.11.2020 | 94,0 | 100,0 | 80,7 |
© Bayerisches Landesamt für Umwelt 2024