
- Startseite >
- Meteorologie >
- Relative Luftfeuchte >
- Unterer Main >
- Greimersdorf >
- Jahresgrafik

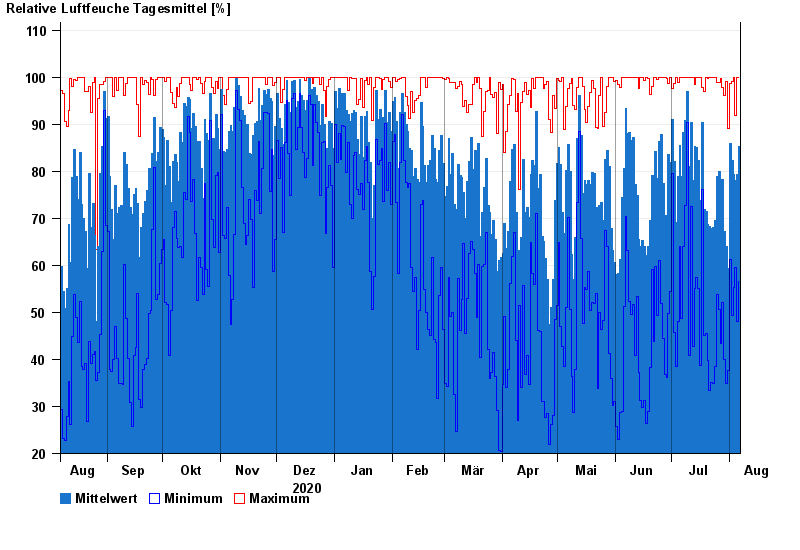
Jahresgrafik Greimersdorf
Relative Luftfeuchte vom 07.08.2020 bis zum 06.08.2021
| Datum | Mittelwert [%] | Maximum [%] | Minimum [%] |
|---|---|---|---|
| 06.08.2021 | 85,3 | 100,0 | 56,5 |
| 05.08.2021 | 79,3 | 100,0 | 48,1 |
| 04.08.2021 | 78,1 | 91,9 | 59,6 |
| 03.08.2021 | 79,4 | 100,0 | 55,3 |
| 02.08.2021 | 82,3 | 99,0 | 49,4 |
| 01.08.2021 | 86,0 | 98,6 | 61,3 |
| 31.07.2021 | 59,4 | 89,0 | 37,7 |
© Bayerisches Landesamt für Umwelt 2024