
- Startseite >
- Meteorologie >
- Relative Luftfeuchte >
- Unterer Main >
- Heilsbronn_Aich >
- Jahresgrafik

Jahresgrafik Heilsbronn_Aich
Relative Luftfeuchte vom 23.10.2020 bis zum 22.10.2021
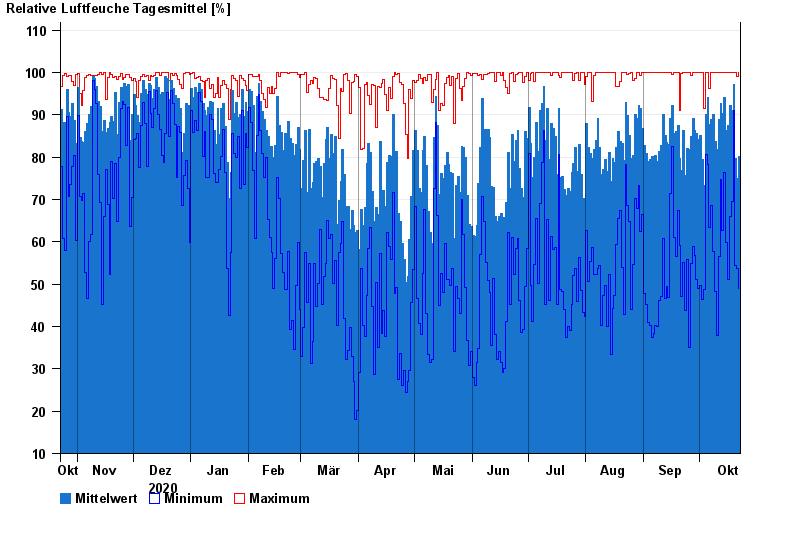
| Datum | Mittelwert [%] | Maximum [%] | Minimum [%] |
|---|---|---|---|
| 22.10.2021 | 80,2 | 100,0 | 49,0 |
| 21.10.2021 | 74,9 | 99,0 | 53,7 |
| 20.10.2021 | 79,6 | 100,0 | 54,4 |
| 19.10.2021 | 97,1 | 100,0 | 91,0 |
| 18.10.2021 | 91,1 | 99,9 | 69,5 |
| 17.10.2021 | 92,3 | 100,0 | 66,1 |
| 16.10.2021 | 87,4 | 100,0 | 51,1 |
© Bayerisches Landesamt für Umwelt 2024