
- Startseite >
- Meteorologie >
- Relative Luftfeuchte >
- Unterer Main >
- Albertshofen >
- Jahresgrafik

Jahresgrafik Albertshofen
Relative Luftfeuchte vom 04.02.2022 bis zum 03.02.2023
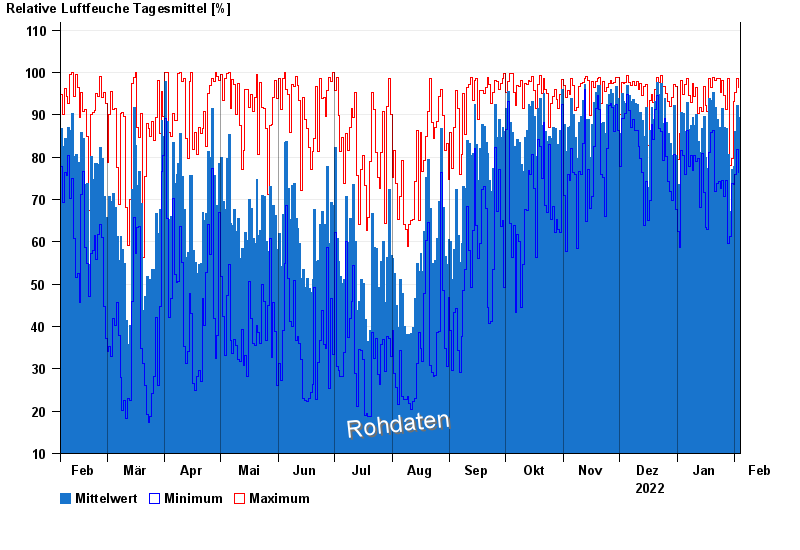
| Datum | Mittelwert [%] | Maximum [%] | Minimum [%] |
|---|---|---|---|
| 03.02.2023 | 89,4 | 96,4 | 76,4 |
| 02.02.2023 | 92,1 | 98,5 | 81,9 |
| 01.02.2023 | 86,1 | 95,3 | 76,0 |
| 31.01.2023 | 77,8 | 93,2 | 73,6 |
| 30.01.2023 | 77,1 | 79,7 | 73,7 |
| 29.01.2023 | 67,1 | 78,1 | 61,3 |
| 28.01.2023 | 80,6 | 98,6 | 59,5 |
© Bayerisches Landesamt für Umwelt 2024