
- Startseite >
- Meteorologie >
- Relative Luftfeuchte >
- Obere Donau >
- Schwabmünchen >
- Jahresgrafik

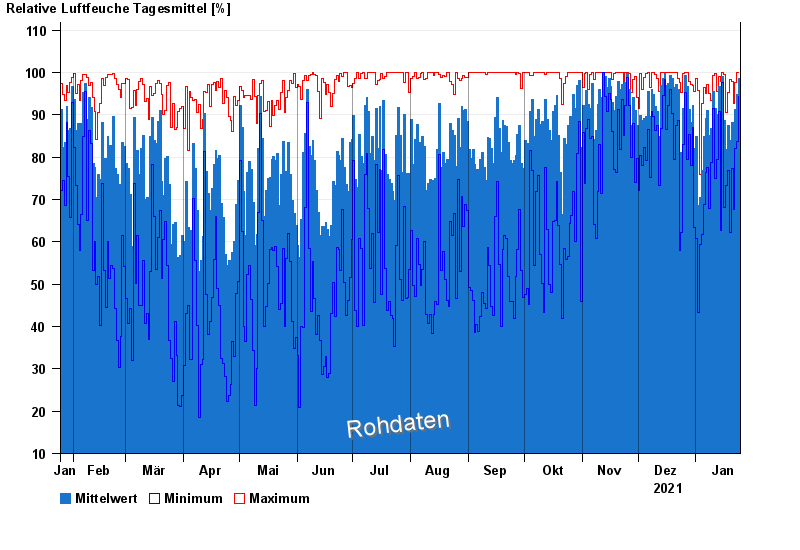
Jahresgrafik Schwabmünchen
Relative Luftfeuchte vom 25.01.2021 bis zum 24.01.2022
| Datum | Mittelwert [%] | Maximum [%] | Minimum [%] |
|---|---|---|---|
| 24.01.2022 | 98,5 | 100,0 | 94,4 |
| 23.01.2022 | 94,7 | 100,0 | 83,6 |
| 22.01.2022 | 91,2 | 97,6 | 82,1 |
| 21.01.2022 | 82,9 | 92,8 | 67,6 |
| 20.01.2022 | 88,1 | 97,9 | 77,3 |
| 19.01.2022 | 84,0 | 98,3 | 62,2 |
| 18.01.2022 | 87,6 | 95,3 | 76,9 |
© Bayerisches Landesamt für Umwelt 2024