
- Startseite >
- Meteorologie >
- Relative Luftfeuchte >
- Obere Donau >
- Schwabmünchen >
- Jahresgrafik

Jahresgrafik Schwabmünchen
Relative Luftfeuchte vom 22.01.2020 bis zum 21.01.2021
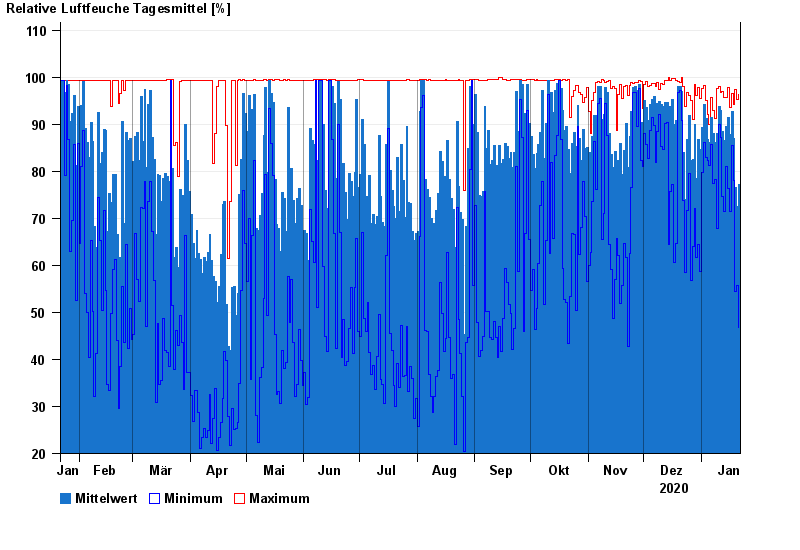
| Datum | Mittelwert [%] | Maximum [%] | Minimum [%] |
|---|---|---|---|
| 21.01.2021 | 77,2 | 96,3 | 46,8 |
| 20.01.2021 | 72,5 | 95,2 | 55,8 |
| 19.01.2021 | 76,5 | 97,3 | 54,4 |
| 18.01.2021 | 86,9 | 94,2 | 78,1 |
| 17.01.2021 | 92,7 | 96,6 | 85,4 |
| 16.01.2021 | 87,9 | 93,6 | 71,5 |
| 15.01.2021 | 91,4 | 97,8 | 76,3 |
© Bayerisches Landesamt für Umwelt 2024