
- Startseite >
- Meteorologie >
- Relative Luftfeuchte >
- Obere Donau >
- Sandharlanden >
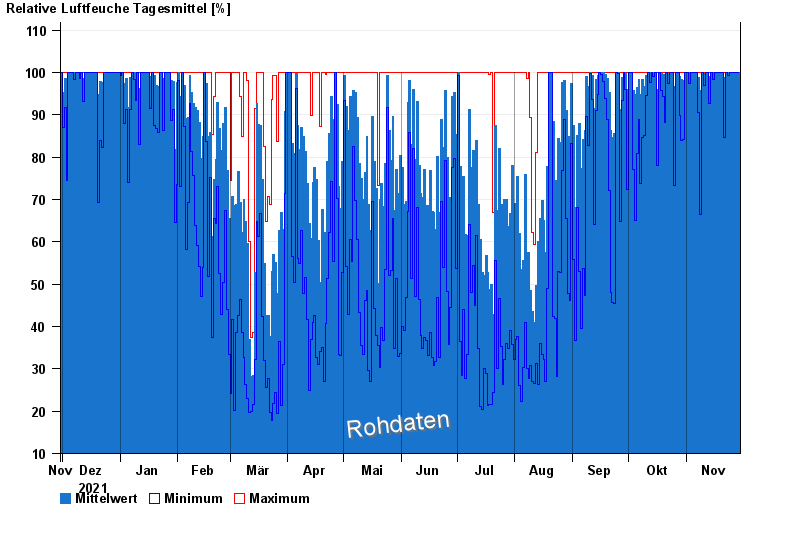
- Jahresgrafik

Jahresgrafik Sandharlanden
Relative Luftfeuchte vom 30.11.2021 bis zum 29.11.2022
| Datum | Mittelwert [%] | Maximum [%] | Minimum [%] |
|---|---|---|---|
| 29.11.2022 | 99,9 | 99,9 | 99,9 |
| 28.11.2022 | 99,9 | 100,0 | 99,9 |
| 27.11.2022 | 99,9 | 99,9 | 99,9 |
| 26.11.2022 | 99,9 | 100,0 | 99,9 |
| 25.11.2022 | 99,9 | 100,0 | 99,9 |
| 24.11.2022 | 100,0 | 100,0 | 99,9 |
| 23.11.2022 | 99,9 | 100,0 | 99,4 |
© Bayerisches Landesamt für Umwelt 2024