
- Startseite >
- Meteorologie >
- Relative Luftfeuchte >
- Obere Donau >
- Sandharlanden >
- Jahresgrafik

Jahresgrafik Sandharlanden
Relative Luftfeuchte vom 29.09.2020 bis zum 28.09.2021
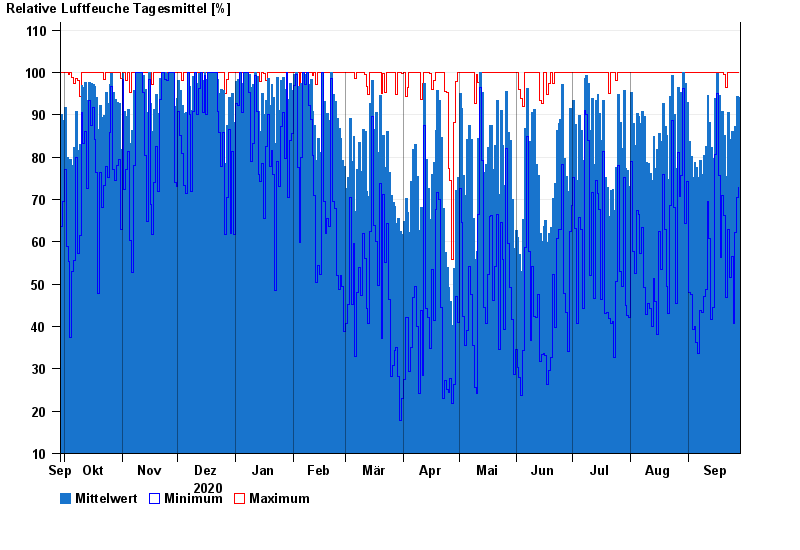
| Datum | Mittelwert [%] | Maximum [%] | Minimum [%] |
|---|---|---|---|
| 28.09.2021 | 94,0 | 100,0 | 72,9 |
| 27.09.2021 | 94,3 | 100,0 | 70,5 |
| 26.09.2021 | 87,3 | 100,0 | 62,1 |
| 25.09.2021 | 82,0 | 100,0 | 40,6 |
| 24.09.2021 | 86,0 | 100,0 | 56,5 |
| 23.09.2021 | 84,1 | 100,0 | 51,5 |
| 22.09.2021 | 90,6 | 100,0 | 62,9 |
© Bayerisches Landesamt für Umwelt 2024