
- Startseite >
- Meteorologie >
- Relative Luftfeuchte >
- Obere Donau >
- Sandharlanden >
- Jahresgrafik

Jahresgrafik Sandharlanden
Relative Luftfeuchte vom 17.06.2022 bis zum 16.06.2023
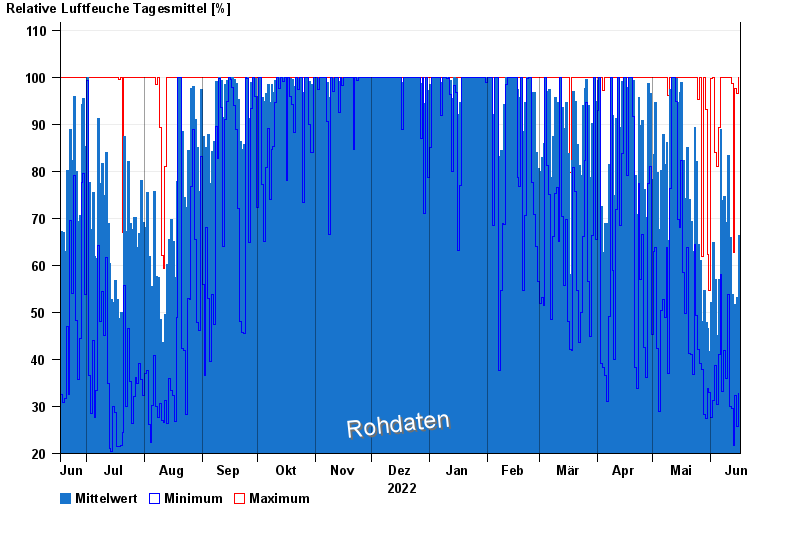
| Datum | Mittelwert [%] | Maximum [%] | Minimum [%] |
|---|---|---|---|
| 16.06.2023 | 66,3 | 100,0 | 32,7 |
| 15.06.2023 | 53,1 | 96,6 | 25,8 |
| 14.06.2023 | 51,6 | 97,5 | 32,3 |
| 13.06.2023 | 39,2 | 62,8 | 21,7 |
| 12.06.2023 | 53,9 | 98,6 | 29,5 |
| 11.06.2023 | 65,9 | 100,0 | 30,0 |
| 10.06.2023 | 83,3 | 100,0 | 53,8 |
© Bayerisches Landesamt für Umwelt 2024