
- Startseite >
- Meteorologie >
- Relative Luftfeuchte >
- Obere Donau >
- Sandharlanden >
- Jahresgrafik

Jahresgrafik Sandharlanden
Relative Luftfeuchte vom 17.06.2020 bis zum 16.06.2021
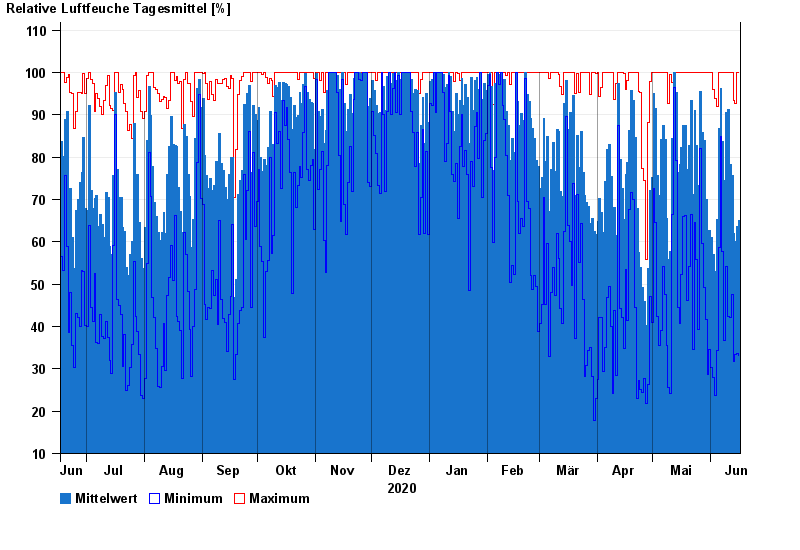
| Datum | Mittelwert [%] | Maximum [%] | Minimum [%] |
|---|---|---|---|
| 16.06.2021 | 65,0 | 100,0 | 33,1 |
| 15.06.2021 | 63,6 | 100,0 | 33,6 |
| 14.06.2021 | 60,0 | 92,8 | 33,4 |
| 13.06.2021 | 62,0 | 93,4 | 31,8 |
| 12.06.2021 | 75,7 | 100,0 | 47,6 |
| 11.06.2021 | 78,3 | 100,0 | 42,1 |
| 10.06.2021 | 91,2 | 100,0 | 42,3 |
© Bayerisches Landesamt für Umwelt 2024