
- Startseite >
- Meteorologie >
- Relative Luftfeuchte >
- Obere Donau >
- Obersteinbach >
- Jahresgrafik

Jahresgrafik Obersteinbach
Relative Luftfeuchte vom 18.01.2022 bis zum 17.01.2023
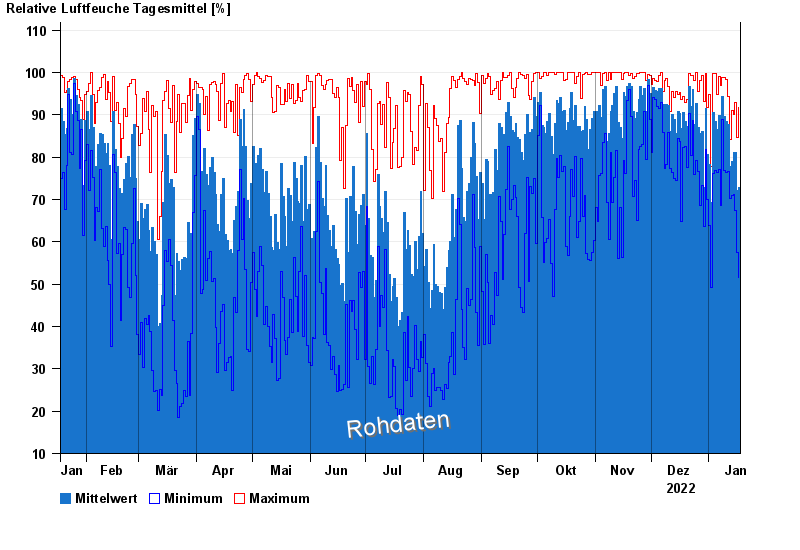
| Datum | Mittelwert [%] | Maximum [%] | Minimum [%] |
|---|---|---|---|
| 17.01.2023 | 72,9 | 91,8 | 51,5 |
| 16.01.2023 | 72,1 | 84,7 | 57,5 |
| 15.01.2023 | 81,1 | 92,9 | 67,3 |
| 14.01.2023 | 81,0 | 90,1 | 71,1 |
| 13.01.2023 | 78,9 | 91,0 | 70,9 |
| 12.01.2023 | 77,9 | 84,2 | 70,3 |
| 11.01.2023 | 87,8 | 94,3 | 76,7 |
© Bayerisches Landesamt für Umwelt 2024