
- Startseite >
- Meteorologie >
- Relative Luftfeuchte >
- Obere Donau >
- Obersteinbach >
- Jahresgrafik

Jahresgrafik Obersteinbach
Relative Luftfeuchte vom 18.01.2021 bis zum 17.01.2022
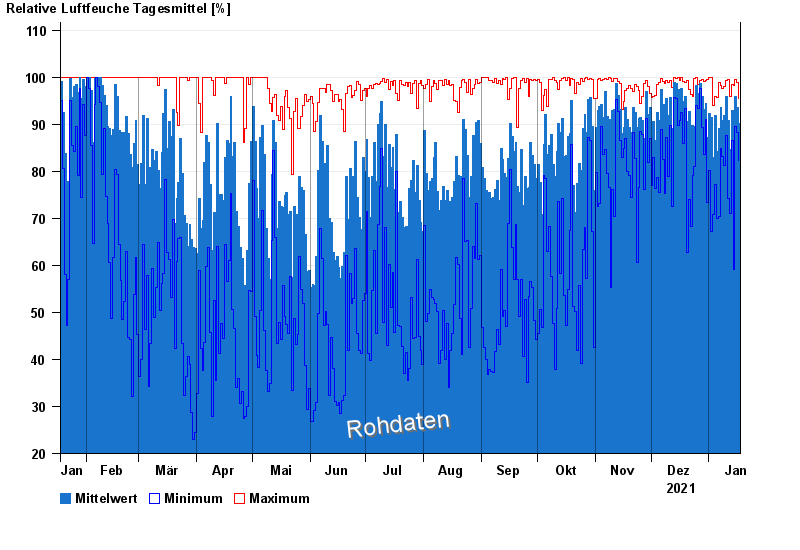
| Datum | Mittelwert [%] | Maximum [%] | Minimum [%] |
|---|---|---|---|
| 17.01.2022 | 90,1 | 95,4 | 82,2 |
| 16.01.2022 | 93,6 | 98,8 | 88,3 |
| 15.01.2022 | 95,8 | 99,6 | 89,5 |
| 14.01.2022 | 88,5 | 98,2 | 59,2 |
| 13.01.2022 | 93,0 | 98,5 | 86,6 |
| 12.01.2022 | 84,7 | 96,0 | 71,0 |
| 11.01.2022 | 90,9 | 99,5 | 74,3 |
© Bayerisches Landesamt für Umwelt 2024