
- Startseite >
- Meteorologie >
- Relative Luftfeuchte >
- Obere Donau >
- Langensallach >
- Jahresgrafik

Jahresgrafik Langensallach
Relative Luftfeuchte vom 28.10.2020 bis zum 27.10.2021
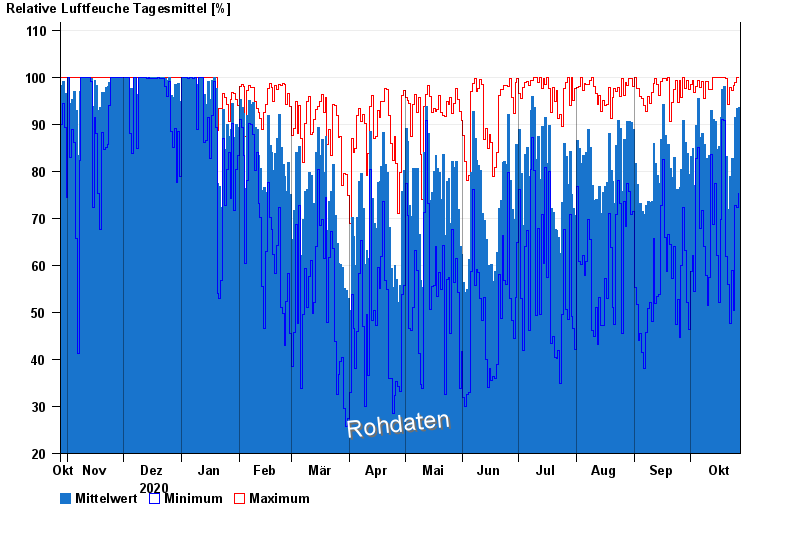
| Datum | Mittelwert [%] | Maximum [%] | Minimum [%] |
|---|---|---|---|
| 27.10.2021 | 93,6 | 99,9 | 75,3 |
| 26.10.2021 | 93,4 | 99,9 | 72,4 |
| 25.10.2021 | 91,5 | 98,9 | 72,7 |
| 24.10.2021 | 77,0 | 98,2 | 50,5 |
| 23.10.2021 | 82,7 | 97,2 | 58,9 |
| 22.10.2021 | 78,9 | 97,8 | 47,6 |
| 21.10.2021 | 71,8 | 94,3 | 56,0 |
© Bayerisches Landesamt für Umwelt 2024