
- Startseite >
- Meteorologie >
- Relative Luftfeuchte >
- Obere Donau >
- Langensallach >
- Jahresgrafik

Jahresgrafik Langensallach
Relative Luftfeuchte vom 20.10.2021 bis zum 19.10.2022
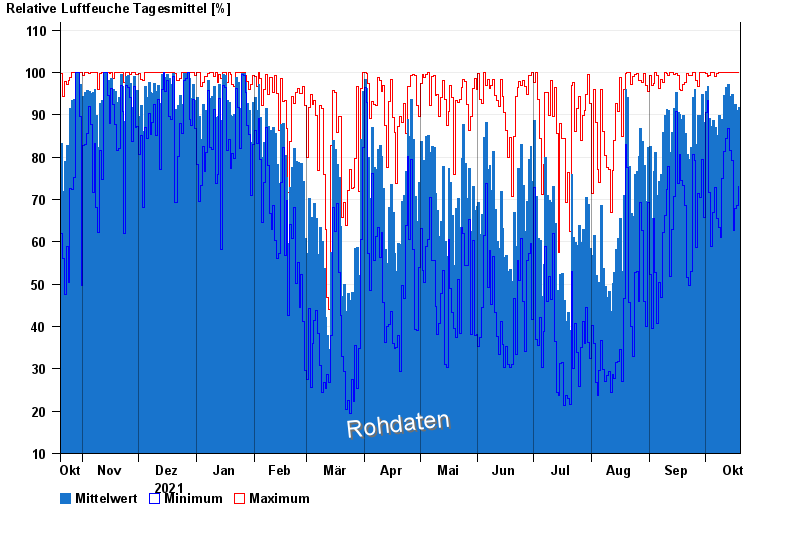
| Datum | Mittelwert [%] | Maximum [%] | Minimum [%] |
|---|---|---|---|
| 19.10.2022 | 91,8 | 99,9 | 73,0 |
| 18.10.2022 | 91,0 | 99,9 | 68,6 |
| 17.10.2022 | 92,5 | 99,9 | 67,8 |
| 16.10.2022 | 88,3 | 99,9 | 62,7 |
| 15.10.2022 | 94,7 | 99,9 | 79,3 |
| 14.10.2022 | 94,4 | 99,9 | 81,6 |
| 13.10.2022 | 97,1 | 99,9 | 86,7 |
© Bayerisches Landesamt für Umwelt 2024