
- Startseite >
- Meteorologie >
- Relative Luftfeuchte >
- Obere Donau >
- Langensallach >
- Jahresgrafik

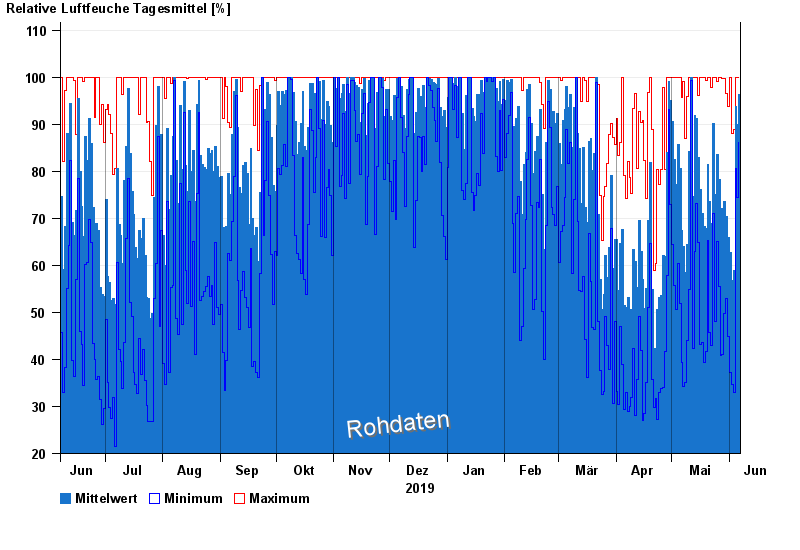
Jahresgrafik Langensallach
Relative Luftfeuchte vom 07.06.2019 bis zum 06.06.2020
| Datum | Mittelwert [%] | Maximum [%] | Minimum [%] |
|---|---|---|---|
| 06.06.2020 | 96,3 | 100,0 | 86,2 |
| 05.06.2020 | 90,0 | 100,0 | 74,5 |
| 04.06.2020 | 93,7 | 100,0 | 80,5 |
| 03.06.2020 | 59,0 | 88,9 | 32,9 |
| 02.06.2020 | 56,8 | 88,1 | 34,6 |
| 01.06.2020 | 62,7 | 100,0 | 37,2 |
| 31.05.2020 | 65,9 | 93,7 | 44,8 |
© Bayerisches Landesamt für Umwelt 2024