
- Startseite >
- Meteorologie >
- Relative Luftfeuchte >
- Obere Donau >
- Karlshuld >
- Jahresgrafik

Jahresgrafik Karlshuld
Relative Luftfeuchte vom 01.01.2019 bis zum 31.12.2019
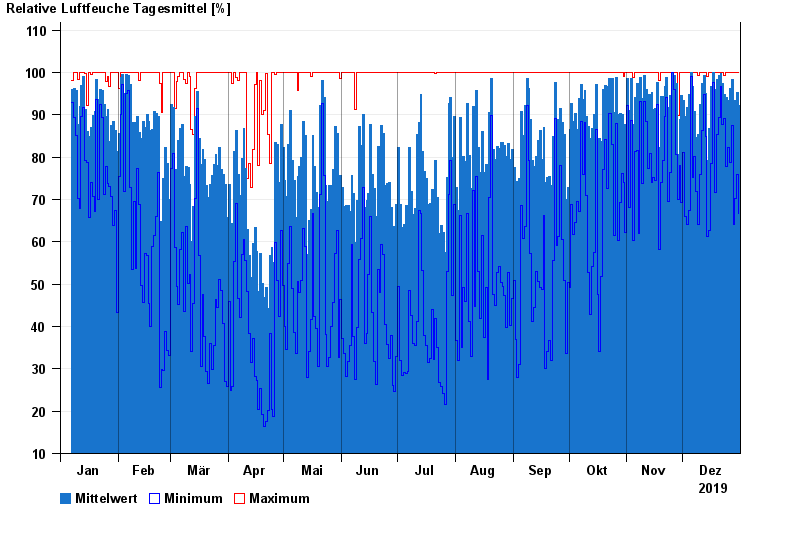
Hinweis: Die Zeitreihe im gewählten Zeitraum weist Lücken auf.
| Datum | Mittelwert [%] | Maximum [%] | Minimum [%] |
|---|---|---|---|
| 31.12.2019 | 92,3 | 100,0 | 66,6 |
| 30.12.2019 | 95,4 | 100,0 | 75,8 |
| 29.12.2019 | 93,3 | 100,0 | 70,3 |
| 28.12.2019 | 89,8 | 100,0 | 64,0 |
| 27.12.2019 | 98,3 | 100,0 | 87,5 |
| 26.12.2019 | 96,3 | 100,0 | 78,8 |
| 25.12.2019 | 93,5 | 100,0 | 82,2 |
© Bayerisches Landesamt für Umwelt 2024