
- Startseite >
- Meteorologie >
- Relative Luftfeuchte >
- Obere Donau >
- Greimersdorf >
- Jahresgrafik

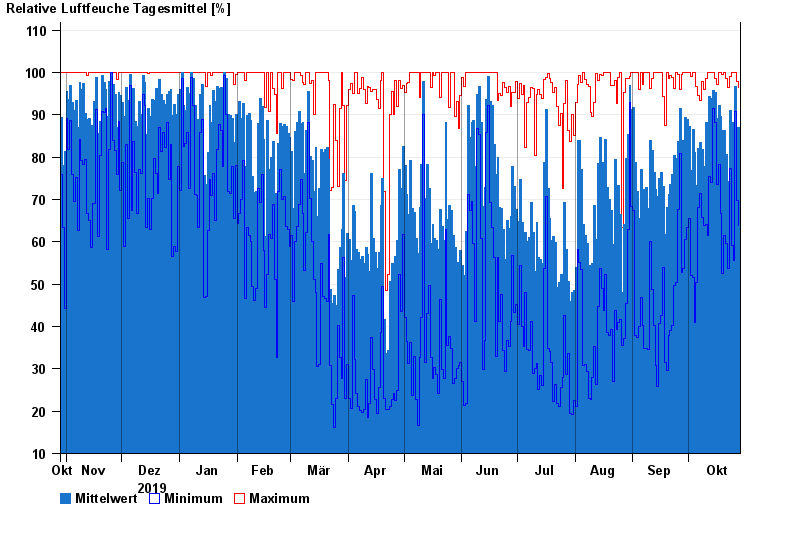
Jahresgrafik Greimersdorf
Relative Luftfeuchte vom 29.10.2019 bis zum 28.10.2020
| Datum | Mittelwert [%] | Maximum [%] | Minimum [%] |
|---|---|---|---|
| 28.10.2020 | 87,0 | 96,5 | 63,9 |
| 27.10.2020 | 86,9 | 97,9 | 69,8 |
| 26.10.2020 | 96,6 | 100,0 | 90,7 |
| 25.10.2020 | 86,6 | 100,0 | 55,5 |
| 24.10.2020 | 88,1 | 100,0 | 59,2 |
| 23.10.2020 | 91,1 | 99,1 | 77,3 |
| 22.10.2020 | 74,3 | 96,5 | 53,8 |
© Bayerisches Landesamt für Umwelt 2024