
- Startseite >
- Meteorologie >
- Relative Luftfeuchte >
- Obere Donau >
- Greimersdorf >
- Jahresgrafik

Jahresgrafik Greimersdorf
Relative Luftfeuchte vom 27.01.2020 bis zum 26.01.2021
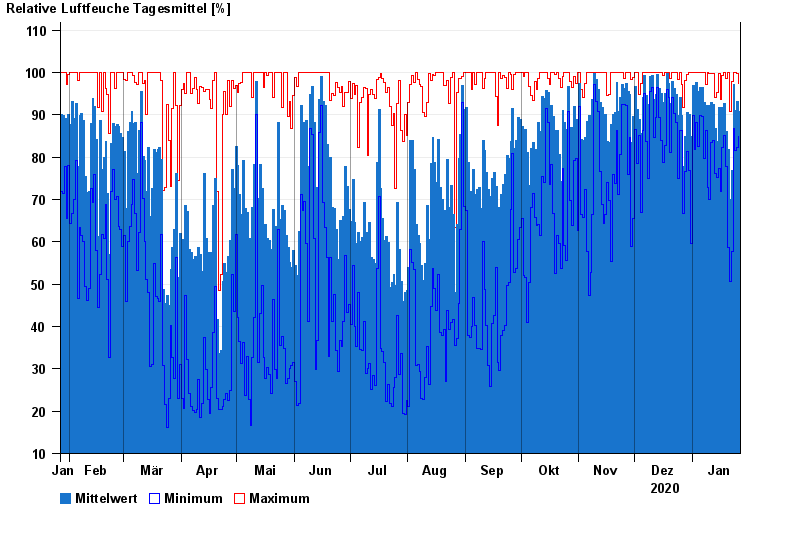
| Datum | Mittelwert [%] | Maximum [%] | Minimum [%] |
|---|---|---|---|
| 26.01.2021 | 90,7 | 97,3 | 84,8 |
| 25.01.2021 | 93,2 | 99,8 | 82,4 |
| 24.01.2021 | 91,1 | 99,9 | 81,5 |
| 23.01.2021 | 97,2 | 100,0 | 86,8 |
| 22.01.2021 | 76,9 | 97,8 | 57,7 |
| 21.01.2021 | 70,0 | 90,7 | 50,6 |
| 20.01.2021 | 81,8 | 100,0 | 58,6 |
© Bayerisches Landesamt für Umwelt 2024