
- Startseite >
- Meteorologie >
- Relative Luftfeuchte >
- Obere Donau >
- Greimersdorf >
- Jahresgrafik

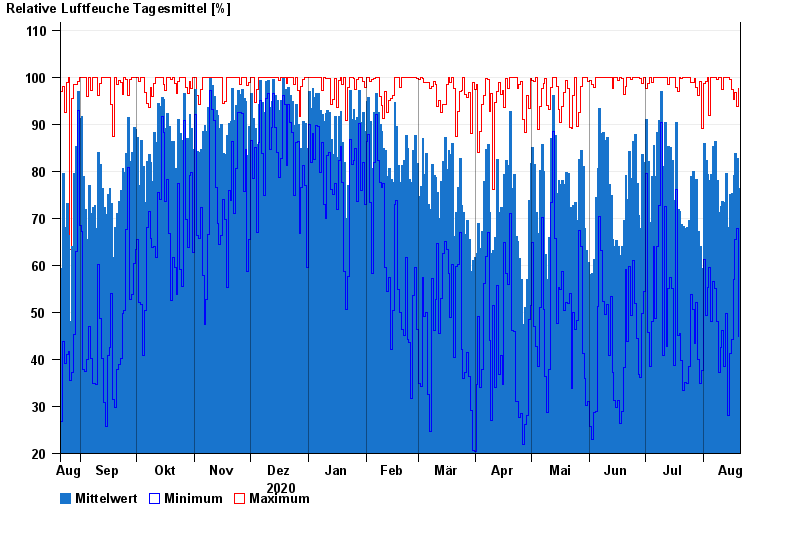
Jahresgrafik Greimersdorf
Relative Luftfeuchte vom 21.08.2020 bis zum 20.08.2021
| Datum | Mittelwert [%] | Maximum [%] | Minimum [%] |
|---|---|---|---|
| 20.08.2021 | 76,4 | 97,7 | 44,8 |
| 19.08.2021 | 82,7 | 93,8 | 67,8 |
| 18.08.2021 | 83,7 | 96,8 | 65,4 |
| 17.08.2021 | 79,2 | 95,2 | 57,0 |
| 16.08.2021 | 75,2 | 97,4 | 44,2 |
| 15.08.2021 | 75,0 | 99,6 | 41,2 |
| 14.08.2021 | 68,0 | 100,0 | 28,1 |
© Bayerisches Landesamt für Umwelt 2024