
- Startseite >
- Meteorologie >
- Relative Luftfeuchte >
- Obere Donau >
- Greimersdorf >
- Jahresgrafik

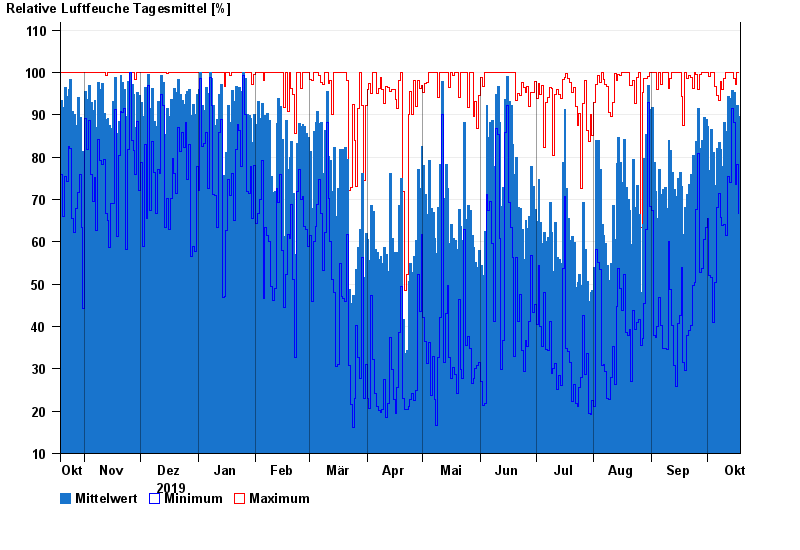
Jahresgrafik Greimersdorf
Relative Luftfeuchte vom 19.10.2019 bis zum 18.10.2020
| Datum | Mittelwert [%] | Maximum [%] | Minimum [%] |
|---|---|---|---|
| 18.10.2020 | 89,6 | 100,0 | 66,7 |
| 17.10.2020 | 92,3 | 100,0 | 78,3 |
| 16.10.2020 | 89,1 | 97,2 | 73,5 |
| 15.10.2020 | 95,3 | 98,5 | 88,3 |
| 14.10.2020 | 95,7 | 100,0 | 91,6 |
| 13.10.2020 | 93,8 | 100,0 | 74,0 |
| 12.10.2020 | 94,4 | 100,0 | 75,4 |
© Bayerisches Landesamt für Umwelt 2024