
- Startseite >
- Meteorologie >
- Relative Luftfeuchte >
- Obere Donau >
- Greimersdorf >
- Jahresgrafik

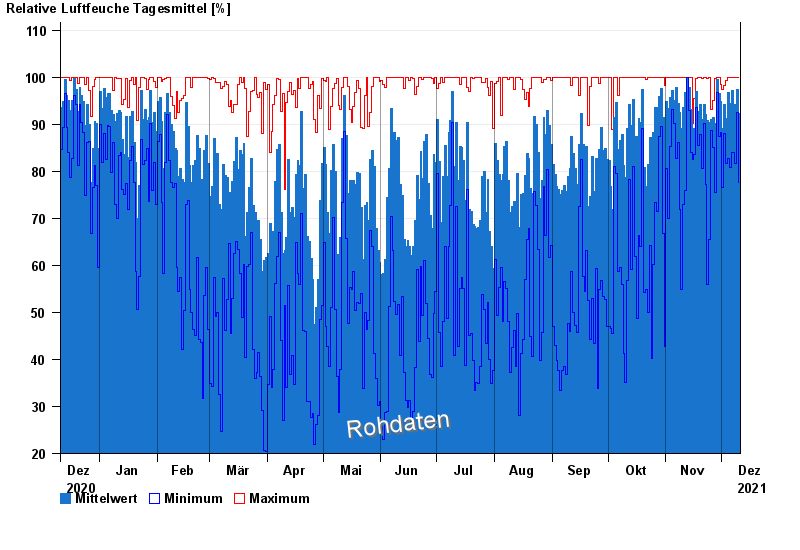
Jahresgrafik Greimersdorf
Relative Luftfeuchte vom 11.12.2020 bis zum 10.12.2021
| Datum | Mittelwert [%] | Maximum [%] | Minimum [%] |
|---|---|---|---|
| 10.12.2021 | 92,3 | 99,9 | 77,7 |
| 09.12.2021 | 97,3 | 100,0 | 92,4 |
| 08.12.2021 | 94,3 | 100,0 | 81,6 |
| 07.12.2021 | 93,5 | 100,0 | 84,0 |
| 06.12.2021 | 97,1 | 100,0 | 83,9 |
| 05.12.2021 | 94,5 | 100,0 | 80,9 |
| 04.12.2021 | 96,7 | 100,0 | 82,7 |
© Bayerisches Landesamt für Umwelt 2024